

Prediction Markets Report September 2026: Volume, Open Interest and Platform Rankings
September 2026 edition. Over the past twelve months, sports accounted for almost half of everything traded on Kalshi and Polymarket, and combination contracts for about a quarter. Politics and elections took about 6% of that volume, yet held over 40% of the money at risk on an average day. Two platforms run 97% of the market, and every challenger to them has failed.
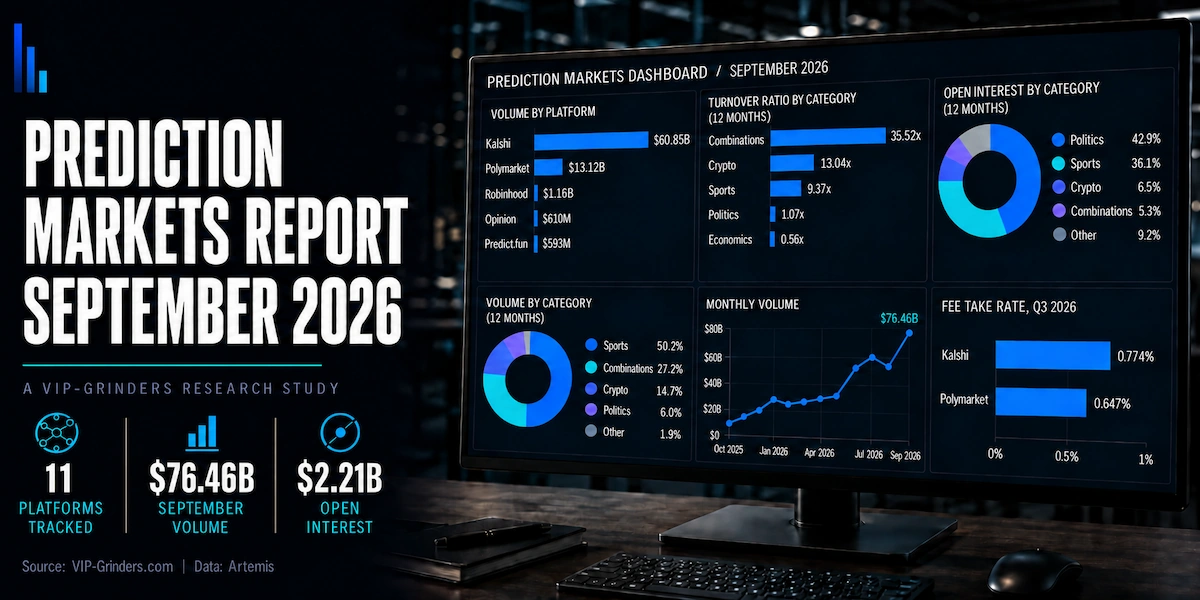
This report tracks prediction market activity across 11 platforms using data sourced from Artemis. Rankings cover trading volume and open interest separately, with the full dataset refreshed every month. Category and fee analysis covers Kalshi and Polymarket only, which together are 96.7% of event contract volume. Rankings, category and fee figures all exclude Kalshi perpetual futures and Nadex binary options, neither of which are event contracts.
- Trading volume: the total notional value of contracts traded over a period. Notional counts both sides of every matched trade, so prediction market volume is not directly comparable to sportsbook handle.
- Open interest: the total value of contracts currently open and unresolved. Unlike volume, it is a snapshot of money at risk rather than a running total, so repeat trading cannot inflate it.
- Turnover ratio: the median of each week's trading volume divided by that week's average open interest, calculated by VIP-Grinders. A high ratio means positions are traded repeatedly before they resolve, while a low ratio means they are held to settlement.
- Platforms covered: Kalshi, Polymarket, Opinion, Nadex, Predict.fun, Rothera (the exchange behind Robinhood), Probable, Limitless, ForecastEx, HIP-4 (Hyperliquid) and Myriad.
- Update cadence: monthly. Each edition covers one calendar month and is published on the first of the following month.
Key Findings
All figures below are sourced from Artemis unless otherwise noted. Category, fee and turnover figures cover Kalshi and Polymarket only, which together are 96.7% of event contract volume. Data covers 1 to 30 September 2026, with trailing twelve month figures running from 1 October 2025.
- Over twelve months, sports is 50.2% of trading volume but only 36.1% of open interest. Sports contracts resolve in hours, so the same capital is recycled repeatedly through the month. In September alone combinations overtook it, taking 52.8% of volume against 31.1% for sports.
- Politics and elections are 6.0% of volume but 42.9% of open interest. That inversion has held every month for a year. The headline that prediction markets have become sports betting is true of turnover, not of capital.
- Sports turns over 9.37 times a week against 1.07 for politics. Crypto is higher still at 13.04, and combination contracts turn over 35.52 times. Volume therefore overstates any category that settles quickly, which is why every figure in this report is paired with open interest.
- September volume rose 51.7% to a record $76.46bn. Kalshi's combination contracts nearly doubled to $35.47bn and account for two thirds of the increase. Open interest rose 50.6% to $2.21bn, so new money is being committed, not just traded faster.
- Kalshi and Polymarket now run 96.7% of event contract volume, up from 63.0% in December. The top spot behind them has changed hands four times in eleven months and nobody has held it. Robinhood's exchange nearly doubled in September to take it back.
- Kalshi has taken $2.39bn in fees over twelve months. Its Q3 take rate was 0.774% of event contract notional against Polymarket's 0.647%, so the gap per dollar traded has narrowed to about 1.2 times.
- 91.6% of all volume ever tracked happened in the last twelve months. Kalshi and Polymarket together took $4.51bn in September 2025 and $73.97bn in September 2026, a sixteenfold increase on a like for like basis.
These are the headline numbers. The sections below break down the data behind each one: platform rankings and market share, the turnover gap between volume and open interest, what people actually trade, how prediction markets compare to betting exchanges and sportsbooks, platform fee economics, and who is winning and losing on these platforms.
Prediction Market Volume Rankings
The rankings below are based on trading volume as reported by Artemis. Volume is notional, meaning it counts both sides of every matched trade, and it includes market-maker activity, arbitrage and positions opened and closed before resolution. It is not a measure of money staked, and it is not comparable to sportsbook handle.
September was the largest month on record. Total event contract volume reached $76.46bn, above July’s $57.54bn when the World Cup was still running, and every platform with more than $100M of volume grew except Opinion.
Open interest moved with it. It closed September at $2.21bn, up 50.6% from $1.47bn at the end of August, so the growth is new money being committed and not only the same capital trading faster.
| # | Platform | This Month | Last Month | MoM Change | Open Interest |
|---|---|---|---|---|---|
| 1 | Kalshi | $60.85B | $40.03B | Up 52.0% | $1.48B |
| 2 | Polymarket | $13.12B | $8.50B | Up 54.4% | $636.7M |
| 3 | Rothera (Robinhood) | $1.16B | $594M | Up 94.5% | $74.3M |
| 4 | Opinion | $610M | $740M | Down 17.5% | $3.4M |
| 5 | Predict.fun | $593M | $417M | Up 42.1% | $12.0M |
| 6 | HIP-4 (Hyperliquid) | $81M | $22M | Up 265.4% | n/a |
| 7 | Limitless | $38M | $96M | Down 60.5% | $0.3M |
| 8 | ForecastEx | $19M | $24M | Down 18.3% | $9.8M |
| Total | Event contracts | $76.46B | $50.42B | Up 51.7% | $2.21B |
Last month’s figures are restated. The August edition subtracted Kalshi’s perpetual futures from a volume total that never included them, which understated Kalshi and the market total by $15.34bn. See Methodology for details.
Kalshi took 79.6% of all event contract volume in September, and Polymarket a further 17.2%. No other platform reached 2%. Myriad and Probable reported no volume at all, and Nadex is excluded throughout as a binary options exchange rather than an event contract venue.
Kalshi and Polymarket grew at almost the same rate, 52.0% against 54.4%, for different reasons. Most of Kalshi’s increase came from combination contracts, which nearly doubled to $35.47bn, while Polymarket’s US entity more than doubled to $8.75bn.
Rothera, the exchange behind Robinhood, rose 94.5% from $594M to $1.16B, the biggest rise of any platform above $100M of monthly volume. It launched in May and its June and July figures were built almost entirely on World Cup contracts. September is its first month above $1B without the tournament.
Volume and Open Interest: The Turnover Gap
Volume and open interest measure different things, and the gap between them is the most useful signal in this dataset. Volume is the running total of everything traded. Open interest is the money sitting in unresolved positions right now.
In betting terms, volume is handle and open interest is the money tied up in bets that have not settled. Back a team at 2.0 and lay it at 1.8 to lock in a profit, and you have generated twice the matched volume on a single economic position. Prediction markets work the same way, and some categories do it far more than others.
The turnover ratio below divides each week’s volume by that week’s open interest and takes the median week, for each category over the twelve months to 30 September. A reading of 9x means the category traded nine times its outstanding value in a typical week.
| Category | Share of Volume | Share of Open Interest | Turnover Ratio |
|---|---|---|---|
| Exotics (combinations) | 27.2% | 5.3% | 35.52x |
| Crypto | 14.7% | 6.5% | 13.04x |
| Sports | 50.2% | 36.1% | 9.37x |
| Climate and weather | 0.4% | 0.4% | 7.62x |
| Financials | 0.5% | 2.4% | 1.47x |
| Entertainment | 0.6% | 2.5% | 1.33x |
| Politics and elections | 6.0% | 42.9% | 1.07x |
| Science and technology | 0.2% | 1.9% | 0.73x |
| Economics | 0.2% | 2.1% | 0.56x |
Sports generates 50.2% of trading volume from 36.1% of the money at risk. Politics and elections do the opposite, producing 6.0% of volume while holding 42.9% of open interest. A political contract is bought and held for months or years because that is when it resolves. A sports contract resolves in three hours and the capital is recycled the same evening.
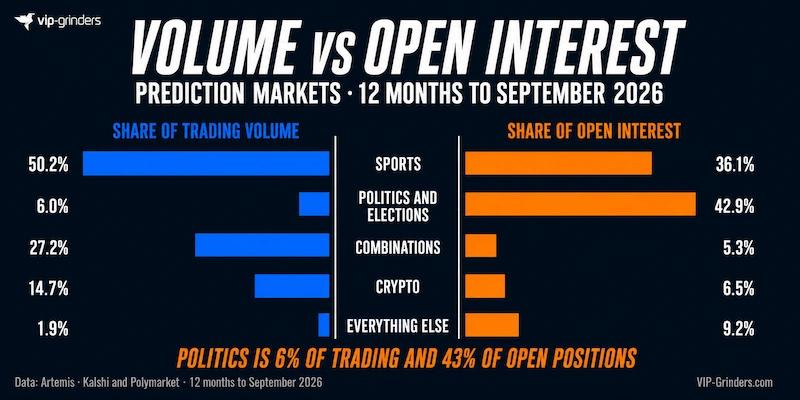
That is why volume alone is a poor measure of this market. It systematically overstates any category that settles quickly, and combinations, crypto and sports settle faster than anything else on these platforms.
What Drives Sports Turnover
Four mechanisms account for the gap, and none of them involve more people betting.
- Live in-play trading. Both platforms run continuous markets during games, so a single fixture generates trades from kick-off to final whistle rather than one bet beforehand. Politics has no equivalent, because there is nothing to react to between now and polling day.
- Market maker rebates. Kalshi's maker fee is roughly a quarter of its taker fee, and Polymarket runs both a maker rebate and a liquidity rewards pool. Professional firms quoting both sides of a market generate volume continuously without ever taking a directional position.
- Cross-platform arbitrage. The same event is often priced differently on Kalshi and Polymarket, and against sportsbook lines. Documented edges run between 1% and 5%, and closing them requires trades on both sides, so each arbitrage counts twice in the volume figures.
- Closing positions before resolution. Traders sell out of winning positions rather than waiting for settlement, exactly as a bettor takes a cash-out. Every position closed early doubles the volume attached to a single economic bet.
Economics sits at 0.56x, meaning the category trades roughly half its outstanding value in a week. Those are contracts on inflation prints and jobs numbers, bought and held to the data release. Science and technology behaves the same way at 0.73x.
This is why headline prediction market volume should not be compared to sportsbook handle without adjustment. A sportsbook counts a bet once when it is struck. A prediction market counts every trade in and out of the same position, and on sports that happens roughly nine times a week.
Political Markets: Where the Money Sits
The turnover table above contains the most counterintuitive number in this report. Politics and elections take 6.0% of trading volume and hold 42.9% of open interest.
Prediction markets are routinely described as having become sports betting platforms. On volume that is accurate. On money actually committed it is close to the opposite, because political contracts resolve in months or years rather than hours, and the capital stays locked in for the duration.
A sports contract is opened and closed the same evening. A contract on the 2028 presidential election has been open since 2024 and will not settle for another two years.
The Largest Political Markets
The table below covers six of the most followed political markets on Polymarket, with implied probabilities as at 30 September 2026 and traded volume as at 3 October 2026. Polymarket publishes this data openly. Kalshi’s terms restrict commercial use of its market data, so Kalshi political markets are not included.
| Market | Volume | Leading Position |
|---|---|---|
| Democratic Presidential Nominee 2028 | $1.29B | Ocasio-Cortez 17%, Newsom 16% |
| Presidential Election Winner 2028 | $712M | Vance 21%, Ocasio-Cortez 13% |
| Next Prime Minister of Ethiopia | $286M | Abiy Ahmed 97% |
| US announces end of Iranian blockade | $34.8M | By 31 December 2026: 59% |
| Balance of Power: 2026 Midterms | $15.6M | Democrats sweep 63% |
| Trump out as President before 2027 | $12.3M | 4.5% |
The 2028 cycle is the whole story. Two markets on a race more than two years away account for $2.00bn between them, about 150 times the $12.9M on the three open Trump exit markets.
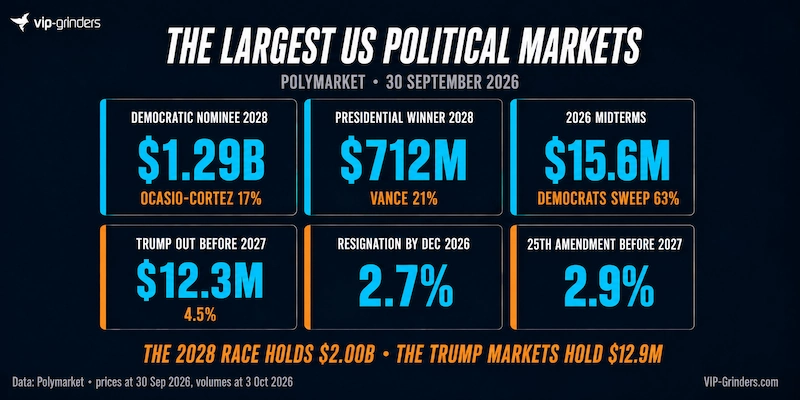
That gap is worth sitting with. Markets on near-term political outcomes attract far more media attention than money. Markets on a distant election attract far more money than attention.
Ethiopia at $286M is the other surprise, and a reminder that Polymarket is a global venue rather than a US one. It is one of the largest political markets on the platform.
The Trump Exit Markets
A cluster of contracts covers whether Donald Trump leaves office before the end of his term. They are frequently cited and comparatively small.
- Trump out as President before 2027: $12.3M traded, 4.5% at the end of September. The largest open market in the group and the most widely quoted.
- Trump out as President by 31 August: $1.8M traded, under 1%. Now resolved.
- Resignation by 31 December 2026: 2.7%.
- Removal via the 25th Amendment before 2027: 2.9%.
The main contract has traded since November 2025 and its implied probability has fallen from roughly 20% to 4.5%, with the sharpest decline between May and July 2026.
What that price represents is worth stating plainly. It is the rate at which traders were willing to take the other side, not a forecast, and on a market of this size a relatively small number of participants set it. For comparison, the 2028 nominee market carries roughly a hundred times the volume.
Why Political Markets Hold Capital
Three structural reasons explain the open interest concentration.
Political contracts have long resolution horizons, so money committed in 2026 to a 2028 outcome sits there for two years. Sports capital turns over the same week.
They also attract position holders rather than traders. Someone who believes a candidate is underpriced buys and waits, because there is no in-play equivalent and little to react to between now and polling day.
And they are the markets institutions and hedgers use. A contract on an election outcome has genuine hedging value for anyone whose business depends on the result, which is not true of a contract on a Tuesday night basketball game.
Prediction Markets Are Betting Exchanges With a Federal Licence
Most coverage treats prediction markets as something new. The trading model is not. Betfair launched peer-to-peer betting in 2000, and Smarkets, Matchbook and Betdaq followed over the next two decades.
What is new is the wrapper. Kalshi and Polymarket US operate as CFTC-designated contract markets, which places them under federal derivatives regulation rather than state gambling law. The second change is scope, because an exchange that once listed only sport now lists elections, inflation prints and Bitcoin prices alongside it.
The Real Break Is How Winners Are Treated
The structural difference between these platforms and the exchanges that came before them is not the technology. It is what happens when you win.
Betfair’s Exchange does not close winning accounts. It charges them. The Premium Charge, introduced in 2008, was replaced in January 2025 by the Expert Fee, which takes 20% of gross profit above £25,000 over a rolling year and 40% above £100,000, per Betfair’s published charges.
Kalshi, Polymarket and Novig all market on not limiting winning traders. That pitch is aimed at the incumbent exchange as much as at sportsbooks, and it is the clearest competitive difference between the two generations.
Three Different Ways to Charge for a Bet
The cost comparison between these models is regularly reported as a single percentage. It cannot be, because the three models charge on entirely different bases.
| Model | How the operator earns | Charged on | Typical rate |
|---|---|---|---|
| Sportsbook | Margin built into the odds | Every bet, win or lose | 4.76% overround on a two-way market, 10.16% blended hold |
| Betting exchange | Commission on net winnings | Winning markets only | 2% to 5%, plus 20% to 40% above profit thresholds |
| Kalshi | Explicit fee on notional | Every matched trade, both entry and exit | 0.77% effective on event contracts, peaking at 1.75% |
| Polymarket | Explicit fee on notional | Every matched trade, both entry and exit | 0.65% effective |
A sportsbook pricing a two-way market at -110 on both sides is quoting implied probabilities that sum to 104.76%. That 4.76% overround works out to a house edge of about 4.55% per dollar staked, and it is charged whether the bet wins or loses because it is inside the price. US sportsbooks held 10.16% of handle across 2025, a figure inflated by parlays carrying far higher margin than straight bets.
A prediction market quotes YES and NO summing to roughly 100 cents and charges a visible fee on top. On a coin flip contract held to resolution, a Kalshi taker pays 1.75 cents on a 50 cent stake, about 3.4% of the money committed, against roughly 4.5% at a sportsbook pricing both sides at -110. That is cheaper by about a quarter and well under the 10.16% blended hold, but not by the multiple that take rates per dollar of notional suggest.
That advantage narrows for anyone who trades in and out, because the fee applies to every matched trade rather than once per bet. At the sports turnover rates in the previous section, a position recycled repeatedly pays the fee repeatedly.
The Substitution Is Now Measurable
US legal sportsbook handle reached $166.94bn in 2025, up 11.0%, generating $16.96bn in revenue, according to the American Gaming Association. That is the benchmark this market is measured against, and it is starting to move.
H2 Gambling Capital estimated prediction markets accounted for roughly 27% of all legal US sports betting volume during the World Cup, up from about 9% at the start of 2026. The American Gaming Association puts diverted state tax revenue above $500m and reported that May 2026 handle fell year on year.
The AGA is not a neutral observer here, and its members lose when this volume moves. But the direction is corroborated by the handle data itself, and by the scale of what these platforms now process: $173.7bn of sports volume over the twelve months to September 2026, excluding combinations, against $166.94bn of sportsbook handle across calendar 2025. In July, the latest month the AGA has published, US sportsbooks took $11.60bn of handle while Kalshi and Polymarket traded $25.56bn of sports contracts.
Those two figures cover different periods and are not equivalent measures. Notional volume counts both sides and every round trip, while handle counts a bet once. The comparison shows order of magnitude, not substitution one for one, and this report tracks the gap between them each month rather than treating them as the same number.
The convergence runs both ways. In 2026 Roobet became the first crypto casino to launch prediction markets, which is the same trade being offered from the opposite direction.
For where the rest of the gambling dollar is going, our Online Poker Traffic Report tracks 36 networks monthly, and our US Gambling Survey covers how Americans actually bet.
Kalshi and Polymarket Run Different Businesses
The two platforms look similar in aggregate and are not. They share a trading model and almost nothing else in what they list, who trades on it, or how they make money.
| Category | Kalshi | Polymarket |
|---|---|---|
| Sports | $118.3B | $55.3B |
| Politics | $2.5B | $18.4B |
| Crypto | $33.0B | $17.8B |
| Exotics (combinations) | $94.1B | None listed |
| Twelve month volume | $257.5B | $109.1B |
Twelve months to 30 September 2026. Polymarket’s total includes $13.7B that sits outside Artemis’s named categories.
Politics is 88% Polymarket. Combination contracts are 100% Kalshi. Sports and crypto are the only categories both platforms compete in seriously, and Kalshi holds roughly two thirds of each.
Kalshi’s Exotics Are Parlays
Kalshi’s largest single market is a combination contract, and the category is barely a year old. In September combinations took $35.47bn, 58.3% of Kalshi’s event contract volume and 2.4 times its sports volume. These are multi-leg products that pay out only if every leg resolves correctly, which is the definition of a parlay.
The structure is genuinely different from a sportsbook parlay. Kalshi cannot take the other side of a customer trade, because CFTC rules prohibit a designated contract market from acting as counterparty. Combinations are priced through a request-for-quote system in which market makers compete to fill the order.
The economics are less different. The counterparty is always a professional firm, with Susquehanna as the flagship market maker alongside Kalshi’s own affiliated trading arm. The app offers no way to take the other side of someone else’s combination, which reserves that position for firms trading through the API.
Combination contracts also explain a quirk in the turnover data. They trade at an average implied probability of around 9%, so a dollar of notional represents roughly nine cents of committed capital, which produces turnover ratios far above any other category.
Kalshi Is Becoming a Derivatives Exchange
On 3 June 2026 Kalshi listed the first CFTC-regulated perpetual futures in US history, starting with Bitcoin. Artemis now tracks contracts on 16 named crypto tokens plus gold, silver, platinum and palladium. Those contracts have taken $64.70bn since launch on top of $173.83bn in event contracts over the same period, and $27.32bn in September alone.
Perpetual futures are not event contracts. They are leveraged derivatives with no resolution date, and Artemis reports them separately from Kalshi’s event contract volume, so they sit outside every ranking, category and fee figure in this report.
The direction matters more than the exclusion. Kalshi is no longer only a prediction market: in September its perpetual futures volume was equal to 45% of its event contract volume.
Polymarket Runs Two Separate Businesses
Polymarket International settles on a public blockchain and is not CFTC-regulated. Polymarket US operates through a designated contract market acquired in 2025 and serves American traders under federal oversight.
The US entity has taken $25.45bn since February 2026, including 66.7% of Polymarket’s volume in September. That is more than Robinhood’s exchange, Predict.fun, Limitless and Probable have taken in their entire existence combined, built in eight months from a standing start.
The two entities charge differently. Since February, US traders have paid 0.639% of notional against 0.361% internationally, so the regulated version has cost roughly 1.8 times as much to trade on. In August the two converged near 0.75%, with International already slightly higher, and in September the gap widened to 0.706% against 0.538% in the US.
Platform Fee Economics
Prediction markets charge an explicit fee rather than building margin into the price, which is the same model a poker room uses when it takes rake from the pot. The house is not betting against you, it is charging you to play.
The rates are public and the volumes are tracked, so unlike casino gross gaming revenue, this is one corner of gambling where operator economics can be calculated rather than estimated.
| Platform | Fees, Trailing 12 Months | Q3 2026 Take Rate | Fee Charged On |
|---|---|---|---|
| Kalshi | $2.39bn | 0.774% | Takers, with makers at a quarter rate |
| Polymarket US | $162.6M | 0.639% | Takers, with 25% rebated to makers |
| Polymarket International | $227.2M | 0.656% | Takers, makers free |
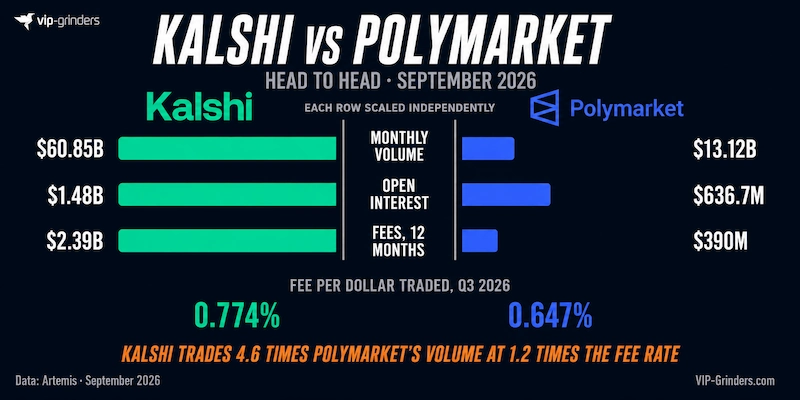
Kalshi has taken $2.39bn in fees over twelve months, more than six times Polymarket’s $389.8M across both entities. Its Q3 take rate of 0.774% on event contracts is 1.2 times Polymarket’s blended 0.647%. Kalshi’s rate has fallen every month for a year, from 1.43% in September 2025 to 0.64% in September 2026, as more of its volume moved into combinations priced at long odds, where its fee formula charges least.
The blended rate hides two businesses moving in opposite directions. Since February, American traders have paid 0.639% while international traders paid 0.361%, so the regulated entity has cost roughly 1.8 times as much to trade on. In August the two converged near 0.75%, with International already slightly higher, and in September International charged 0.706% against 0.538% in the US.
Kalshi’s fee formula explains why the rate moves. Its published fee schedule sets the taker fee at 0.07 multiplied by the number of contracts, the price, and one minus the price, which peaks at 1.75% when a contract trades at 50 cents and falls toward both extremes. A contract at 90 cents costs about 0.63%.
That structure charges most where uncertainty is highest. A coin-flip market is the most expensive thing to trade on Kalshi, and a near-certainty is among the cheapest.
What the Fees Buy
An independent analysis of Kalshi trade data estimated its 2025 take rate at just under 1.2%, with roughly 89% of fee revenue coming from sports. Our own calculation from Artemis data puts Kalshi’s 2025 rate at 1.322%. Over the trailing twelve months it has fallen to 0.928% as combinations have grown.
That makes Kalshi one of the largest fee-earning gambling operators in the world, taking $2.39bn on $257bn of event contract volume without holding a gambling licence in any jurisdiction. Our crypto casino market report covers the same question for onchain operators, where gross gaming revenue cannot be observed directly at all.
Who Actually Wins on These Platforms
Prediction markets are peer-to-peer, so there is no house taking the other side. That does not mean there is nobody on the other side, and the data on who profits is now public.
Bloomberg analysed Kalshi’s trade records and found that retail traders lost a net $294 million on combination contracts during 2026, before fees. The same analysis found combinations carried an average implied probability of around 9%, against 43% for the platform’s other contracts.
Gambling Insider, benchmarking against New Jersey and Maryland regulatory filings, calculated that combination bettors lose roughly 8 to 9 cents per dollar staked. A sportsbook keeps about 19 cents per dollar on parlays and 6 cents on straight bets.
The Blended Figure Flatters It
That 8 to 9 cent figure covers everyone trading combinations, which includes the professional firms taking the other side. Strip those out and the picture changes.
Gambling Insider’s analysis argues the retail taker’s real loss rate runs two to four times the blended headline, and that over one measured fortnight it was worse than a sportsbook. The averaging works the same way a poker room’s overall rake figure would if you included the regulars in the player pool.
There is a structural reason for the imbalance. Kalshi’s app offers no way to take the other side of someone else’s combination, so that position is available only to firms trading through the API, with Susquehanna as flagship market maker alongside Kalshi’s own trading arm.
The Edge Moved, It Did Not Disappear
On a straight two-way market the exchange model is genuinely cheaper than a sportsbook, for the reasons set out earlier in this report. A taker cost of about 3.4% against roughly 4.5% at a sportsbook is a real saving, and a maker pays a quarter of that fee.
On combinations, that advantage narrows or reverses. The platform is not the counterparty, but a trading firm is, and it prices for a living.
Prediction markets removed the house edge from the price and replaced it with an explicit fee. What they did not remove is the gap in skill between a retail trader and a market maker, and on multi-leg products that gap is where the money goes.
The exchange model is not new. Betfair has matched bettors against each other since 2000, and anyone who traded on it knows the appeal was never that it was cheap. It was that a winning account did not get closed.
What is new is the licence. A CFTC exchange cannot refuse a profitable trader the way a sportsbook can, and it cannot take the other side. That is a genuine structural improvement for anyone who wins.
It is not the same as removing the house edge. On a straight two-way market you keep more of your expectation than at a standard sportsbook. On a multi-leg combination you are trading against a firm that prices for a living, and the numbers say retail is losing that trade.
A Consolidating Duopoly
The headline story is growth. Underneath it, this market is narrowing fast.
Kalshi and Polymarket took 63.0% of event contract volume in December 2025. By September 2026 they took 96.7%. Every platform that has tried to hold third place has lost it inside a few months.
| Platform | Peak Month | Peak Volume | September 2026 | Decline from Peak |
|---|---|---|---|---|
| Opinion | January 2026 | $8.08B | $610M | Down 92% |
| Probable | January 2026 | $1.92B | No volume | Down 100% |
| Rothera (Robinhood) | June 2026 | $2.09B | $1.16B | Down 45% |
| Predict.fun | April 2026 | $1.54B | $593M | Down 62% |
| Limitless | May 2026 | $779M | $38M | Down 95% |
| HIP-4 (Hyperliquid) | June 2026 | $189M | $81M | Down 57% |
The top spot behind Kalshi and Polymarket has changed hands four times in eleven months. Opinion held it from November through March, and in December and January it traded more than Polymarket itself. Predict.fun then took it in April and May, Robinhood’s exchange in June and July, Opinion in August and Robinhood’s exchange again in September on $1.16B, while Opinion did $610M against its $8.08B January peak.
Probable went from $1.71B in February to nothing by May. It and Myriad, which peaked at $125M in February, are the only platforms in the tracked set to have stopped reporting entirely.
Robinhood Lost Third Place, Then Took It Back
Rothera is the clearest test of whether distribution and capital are enough to break into this market. It is a CFTC-regulated exchange and clearinghouse built with Susquehanna, and it routes event contract trades from one of the largest retail brokerages in the United States.
It launched in May, reached $2.09B in June, fell to $594M in August and recovered to $1.16B in September. World Cup contracts still account for 62% of its entire volume.
September complicates the pattern. Robinhood attracted traders for one tournament, lost most of them in August, and climbed back to more than half its June peak a month later. The next few months will show whether it has built a market or rented an audience.
The tail keeps failing for a structural reason. Traders go where the spreads are tightest, spreads are tightest where the volume already is, and liquidity compounds toward whoever has most of it. Every challenger in the table above launched on an event-driven spike and then lost its traders to the two platforms with deeper books.
Biggest Event Benchmark: The 2026 World Cup
Each edition of this report tracks the largest single event in prediction market history. The 2026 World Cup currently holds that position, and it will do until a Super Bowl or a US election displaces it.
Three platforms listed World Cup contracts and took $29.8bn between them across six weeks. The peak week ending 5 July drew $6.55bn, and open interest on tournament contracts peaked at $726.3M in late June.
| Platform | World Cup Volume | Share of Tournament | Share of Platform’s All-Time Volume |
|---|---|---|---|
| Kalshi | $13.81B | 46.3% | 5.2% |
| Polymarket | $12.56B | 42.1% | 9.2% |
| Rothera (Robinhood) | $3.44B | 11.5% | 62.2% |
| Total | $29.80B | 100% | n/a |
The last column is the one that matters. Kalshi and Polymarket both had a strong tournament, but neither depended on it. Rothera took 62% of its entire volume from a single competition, which is why it collapsed the moment the final whistle went.
For scale against the sector this site already tracks, the crypto casino market processed $48.8bn in deposits across 41 operators in the twelve months to September 2026. One football tournament, on three platforms, reached more than three fifths of that in six weeks.
Why Tournament Volume Is Not Tournament Handle
World Cup contracts turned over roughly nine times their open interest in an average tournament week, in line with the sports figure across the rest of this report. The $29.8bn is therefore a trading figure, not a measure of money staked on the outcome.
Artemis also publishes a per-match table for the tournament, and it does not reconcile with the platform totals. Match-level contracts account for $4.96bn against the $29.8bn total, and coverage differs sharply by platform, capturing 11.7% of Kalshi’s tournament volume against 23.1% of Polymarket’s.
That gap means per-match rankings cannot be published from this dataset without misleading readers about which platform led on individual fixtures. Most tournament volume sat in outright winner, group and progression markets rather than single match outcomes.
World Cup contracts took 36.9% of all event contract volume while the tournament ran, from 11 June to 19 July. A market that concentrates more than a third of its activity into one competition is still event-led rather than habit-led, and that is the distinction between a market growing and a market becoming durable.
The next benchmark event will test whether the traders acquired in June and July are still trading.
Regulation: What Would Move These Numbers
Every figure in this report depends on prediction markets remaining legal to operate at their current scale. That question is unsettled, and it is being fought in three places at once.
All three are United States questions. Elsewhere the answer has largely arrived: 26 countries have acted against one or both platforms, each with a published decision behind it. Our research on which countries have banned Polymarket and Kalshi dates each one to the regulator, court or ministry that issued it.
The CFTC Has Moved Toward Permission
Under chairman Michael Selig, confirmed in December 2025, the Commodity Futures Trading Commission withdrew the restrictive rule proposed in 2024. A new proposed rule published in June 2026 sets out a test under which broad-outcome sports contracts, covering final scores, point differentials and tournament progression, are largely permitted.
The scale of the shift is visible in the listings. Event contract filings went from roughly five a year between 2006 and 2020 to about 1,600 in 2025.
In April 2026 the CFTC went further and sued Arizona, Connecticut and Illinois to block state regulation of prediction markets, asserting exclusive federal jurisdiction.
The Courts Are Split
The most important ruling so far went Kalshi’s way. In April 2026 the Third Circuit affirmed an injunction barring New Jersey from enforcing its gambling laws against the platform, holding that sports event contracts are swaps under the Commodity Exchange Act and therefore subject to exclusive CFTC jurisdiction.
Other courts have gone the other way. A Massachusetts state court ruled in January 2026 that Kalshi’s sports contracts are subject to state gaming law, calling the preemption argument overly broad. Nevada secured injunctive relief at district level, and on 28 August 2026 the Ninth Circuit ruled 3-0 in the state’s favour, finding the contracts unlikely to qualify as swaps at all.
That creates a split with the Third Circuit on the same question, and Nevada has since started enforcing.
Arizona filed 20 misdemeanour criminal charges, the first criminal action against Kalshi anywhere. New York’s attorney general and governor sued over unlicensed sports betting, seeking penalties tied to sports revenue. On 1 September 2026 a Michigan state court turned a June restraining order into a preliminary injunction, requiring Kalshi to geofence Michigan users out of sports contracts or pay $500,000 a day.
Tribal Operators Have Their Own Case
Three California tribes sued Kalshi and Robinhood in July 2025 under the Indian Gaming Regulatory Act. A federal court denied a preliminary injunction, holding that IGRA does not reach third-party platforms. On 16 September 2026 the Ninth Circuit reversed, finding the tribes likely to succeed in showing that Kalshi’s sports contracts are unauthorised gaming when entered from tribal land.
More than 60 tribes filed amicus briefs and the Indian Gaming Association launched a litigation fund. Wisconsin tribes have filed separately.
Why the Fight Is About Sports Specifically
Nothing in the litigation concerns inflation contracts or election markets in any serious way. The dispute is about sport, because sport is 50.2% of trading volume and because it is the category that overlaps directly with a licensed, taxed industry.
The American Gaming Association’s position is that these contracts are sports betting under a different name, and that states are losing tax revenue they would otherwise collect. Kalshi’s position is that a federally regulated exchange is not a sportsbook, and that it never takes the other side of a customer trade.
Both are describing the same activity accurately. The disagreement is about which regulatory category it belongs in, and that is a question courts will answer rather than data.
Frequently Asked Questions
How big are prediction markets?
Prediction markets tracked $453 billion in cumulative event contract volume across the 10 event contract platforms tracked here as of September 2026, of which 91.6% was traded in the last twelve months alone. In September 2026 the market processed $76.46 billion. Those figures are notional trading volume, which counts both sides of every matched trade, so they are not directly comparable to sportsbook handle.
Which is bigger, Kalshi or Polymarket?
Kalshi is larger by both volume and fees. It took 79.6% of event contract volume in September 2026 against Polymarket’s 17.2%, and holds $1.48 billion in open interest against Polymarket’s $636.7 million. Kalshi has also earned $2.39 billion in fees over twelve months against Polymarket’s $389.8 million. The two platforms compete seriously only in sports and crypto, where Kalshi holds roughly two thirds of volume in each.
What is open interest in a prediction market?
Open interest is the total value of contracts currently open and unresolved on a platform. Unlike trading volume, which is a running total of everything traded, open interest is a snapshot of money actually at risk at a given moment, and repeat trading cannot inflate it. Across all tracked event contract platforms, open interest stood at $2.21 billion at the end of September 2026 against $76.46 billion of monthly volume.
Are prediction markets gambling?
That question is being litigated rather than settled. Kalshi and Polymarket US operate as CFTC-designated contract markets under federal derivatives regulation rather than state gambling law. In April 2026 the Third Circuit held that sports event contracts are swaps subject to exclusive CFTC jurisdiction, while a Massachusetts state court ruled in January 2026 that they fall under state gaming law. On 28 August 2026 the Ninth Circuit ruled the other way in the Nevada case, so two appeal courts are now split.
Are prediction markets cheaper than sportsbooks?
On a single position held to resolution, yes, but by less than headline rates suggest. A Kalshi taker buying a 50 cent contract pays 1.75 cents in fees, about 3.4% of the money committed, against roughly 4.5% expected cost on a standard two-way sportsbook market and a 10.16% blended hold across US sportsbooks in 2025. The advantage narrows for anyone trading in and out, because the fee applies to every matched trade rather than once per bet, and it narrows further on combination contracts.
Is prediction market volume the same as sportsbook handle?
No. Handle counts a bet once when it is struck. Prediction market volume is notional, counting both sides of every matched trade plus every trade in and out of the same position. Sports contracts turned over 9.37 times their open interest in a typical week, so headline volume systematically overstates the money actually staked.
Why do political markets hold so much open interest?
Politics and elections take 6.0% of trading volume on Kalshi and Polymarket but hold 42.9% of all open interest. Political contracts resolve in months or years rather than hours, so capital committed to them stays locked in for the duration, while sports capital is recycled within the same week. The 2028 US presidential markets alone account for roughly $2.00 billion in traded volume on Polymarket.
What are Kalshi Exotics?
Exotics are Kalshi’s combination contracts, multi-leg products that pay out only if every leg resolves correctly. They are mechanically identical to a sportsbook parlay, though structurally different because Kalshi cannot take the other side of a customer trade. Combinations are priced through a request-for-quote system in which professional market makers compete to fill the order, and the category accounts for $94.1 billion of Kalshi’s all-time volume, including $35.5 billion in September 2026, more than any other Kalshi category that month.
How do prediction markets make money?
They charge an explicit fee on trading rather than building a margin into the odds, in the same way a poker room takes rake from the pot. Kalshi’s taker fee is 0.07 multiplied by the number of contracts, the price, and one minus the price, peaking at 1.75% when a contract trades at 50 cents and falling toward both extremes. Polymarket has charged a lower rate, at 0.639% for US traders and 0.361% internationally since February 2026.
What is the difference between a prediction market and a betting exchange?
Very little in trading mechanics. Betfair launched peer-to-peer betting in 2000 and prediction markets use the same model, matching traders against each other rather than against a house. The differences are regulatory, since Kalshi and Polymarket US operate as CFTC-designated contract markets, and commercial, since prediction markets market explicitly on not limiting winning traders while Betfair applies an Expert Fee of 20% to 40% on gross profit above set thresholds.
Methodology and Data Sources
This report combines primary data from Artemis with secondary figures from industry bodies, regulatory filings and independent analysts. The sections below explain what each source measures, how it is used, and where the limits are.
Primary Data: Artemis
All volume, open interest, trade count, category and fee figures come from Artemis, which tracks 11 prediction market platforms. Data is reported daily, and Kalshi and Polymarket were 96.7% of event contract volume in September 2026, so a two-platform analysis describes almost the entire market.
- What it measures: trading volume (notional value of contracts traded), open interest (value of contracts currently open and unresolved), trade counts, category splits, and platform fee revenue.
- What it does not measure: money staked, unique traders, deposits, withdrawals, or profit and loss by user. Volume counts both sides of every matched trade and includes market maker, arbitrage and round-trip activity.
- Reporting period: Artemis publishes daily data. Monthly figures in this report are calendar months, so this edition covers 1 to 30 September 2026. Trailing twelve month figures run from 1 October 2025.
- Platforms tracked: Kalshi, Polymarket, Opinion, Nadex, Predict.fun, Rothera (the exchange behind Robinhood), Probable, Limitless, ForecastEx, HIP-4 (Hyperliquid) and Myriad.
- Cross-source variance: Artemis figures do not track consistently against other published sources. Against widely reported monthly figures, Artemis ran 0.91x on Kalshi in April 2026 and 1.19x in May. Comparisons between this report and figures sourced elsewhere should be treated with caution.
Two Reporting Tiers
This report works at two levels, and the distinction matters when reading any figure.
Platform rankings, market share and open interest cover every tracked event contract platform, which leaves out Nadex. Category analysis, turnover ratios and fee economics cover Kalshi and Polymarket only, because Artemis does not publish category or fee data for the remaining nine.
That is not a significant limitation at present. Kalshi and Polymarket were 96.7% of event contract volume in September 2026, so a two-platform analysis describes almost the entire market. It would become a limitation if the tail recovered.
Derived Metrics
Two figures in this report are calculated by VIP-Grinders rather than reported by Artemis.
Turnover ratio is the median of each week’s trading volume divided by that week’s average open interest, per category, across the complete Monday to Sunday weeks in the trailing twelve months. The median is used rather than the mean because open interest grew more than fivefold over the period, and dividing a full year of volume by a single end-point would understate the result.
Substitution comparison sets prediction market sports volume against US sportsbook handle as published by the American Gaming Association. The two are not equivalent measures and the report says so wherever the comparison appears.
What We Exclude and Why
Rankings, category and fee figures exclude two products that Artemis tracks but that are not event contracts.
Kalshi perpetual futures, listed from 3 June 2026, are leveraged derivatives with no resolution date. Artemis reports them separately from Kalshi’s event contract volume, and at $27.32bn in September 2026 they would distort both the rankings and the take rate if they were included.
Nadex is a binary options exchange trading currency pairs, indices and commodities rather than event outcomes.
Artemis’s Exotics category contains Kalshi’s combination contracts only and holds no perpetual futures, so Exotics appears in the category and turnover tables as its own row.
Correction: the August 2026 edition treated Kalshi’s perpetual futures as part of its reported volume and subtracted them. They were never included, so August figures for Kalshi and the market total were understated by $15.34bn. Restated, Kalshi took $40.03bn in August rather than $24.68bn, total event contract volume was $50.42bn rather than $35.07bn, and Kalshi’s Q2 take rate was 1.021% rather than 1.318%.
Secondary Sources
| Source | What It Measures | How We Use It |
|---|---|---|
| American Gaming Association | US commercial sportsbook handle and revenue | Benchmark for the substitution comparison |
| H2 Gambling Capital | Prediction market share of US sports betting volume | Third-party estimate of substitution, labelled as such |
| Bloomberg | Retail profit and loss on Kalshi combination contracts | Evidence on who wins and loses |
| Gambling Insider | Combination contract loss rates against state filings | Comparison to sportsbook parlay hold |
| InGame | Kalshi take rate and taker versus maker volume split | Independent check on our fee calculation |
| Kalshi published fee schedule | Taker and maker fee formulas | Explains why the effective rate varies by price |
| CFTC filings and court opinions | Regulatory status and litigation | Regulation section, cited to primary documents |
Limitations
- Counting convention is not published. Artemis does not state whether volume counts one side or both sides of a matched trade, or whether the convention is identical across platforms. Where this report describes volume as counting both sides, that is an assumption, and market shares between platforms could shift if the conventions differ.
- Notional per trade is a derived estimate. It assumes volume and trade counts share a counting basis. If volume counts both sides while trades count each match once, the true figures are roughly half those stated.
- Category data covers two platforms. Roughly $57bn of trailing twelve month volume from the other nine platforms sits outside all category, turnover and fee analysis.
- Categories are created and abandoned. Exotics did not exist before September 2025. Commodities and several event-specific categories appeared within the last year, and others have gone dormant. Year-on-year category comparisons are not like for like.
- Taxonomies differ by platform. Kalshi and Polymarket each expose 20 volume categories, Polymarket reports open interest for only 9, and two labels appear twice in Artemis's own classification. Combined category figures involve mapping judgements, and category shares are calculated across the nine categories in the turnover table, which cover 94.5% of Kalshi and Polymarket volume over the twelve months.
- Per-match and platform totals measure different scopes. Artemis's World Cup per-match table covers 11.7% of Kalshi's tournament volume against 23.1% of Polymarket's, so per-match rankings are not published in this report.
- Volume includes activity that is not betting. Independent research has documented wash trading on prediction markets, alongside market making, arbitrage and incentive-driven volume. Open interest is less exposed to all of these, which is why this report leads with it.
- Some Polymarket volume is uncategorised. Artemis left 42.0% of Polymarket's September volume outside its named categories, against 12.6% across the trailing twelve months. That volume sits outside the category shares and turnover ratios.
- Kalshi category history is incomplete. Artemis's Kalshi category data does not add up to Kalshi's total before October 2025, so category tables use the trailing twelve months only.
- One day of Kalshi fees is missing. Artemis reports no Kalshi fees for 1 September 2026, so September and Q3 fee figures for Kalshi are understated by roughly one day of fees.
Editorial Independence
VIP-Grinders has no commercial relationship with Artemis and no affiliate relationship with any prediction market platform covered in this report. This page carries no affiliate links. No platform pays for inclusion, ranking position, or how it is described.
Update Schedule
This report is part of the VIP-Grinders research programme and is updated monthly. Each edition is published on the first of the month and covers the whole of the previous calendar month.
The next edition covers October 2026 and will be published on 1 November 2026. Our testing and verification standards are set out in how we test.
If you are a journalist, researcher or analyst using data from this report, contact João Mourato at VIP-Grinders for verification, methodology detail, or access to the underlying tables.