

Gambling Addiction Statistics 2026
Gambling is a popular social pastime, with millions worldwide taking part in activities such as sports betting and online gambling. While many play responsibly, for some, gambling participation can develop into problematic behavior and addiction, with potentially serious financial, social, and health consequences.
But how prevalent is gambling addiction, which groups are most at risk, and what support is available for people experiencing gambling harm? To learn more, we’ve collated the latest gambling addiction statistics for 2026, covering problematic gambling rates, demographic breakdowns, common consequences, and gambling addiction treatment statistics.
Top 10 Must-Know Gambling Addiction Statistics
- 1An estimated 2.5 million US adults experience a severe gambling problem, while a further five to eight million experience mild or moderate gambling problems.
- 22.4% of adults in Great Britain met the criteria for experiencing "problem gambling" (PGSI score of eight or more) in 2025.
- 3Men were 3.4 times more likely to experience problem gambling than women worldwide.
- 4Britons who have gambled in the last year and who are in the lowest two income groups are more likely to experience adverse consequences from gambling, with 15% experiencing one or more adverse consequences.
- 582% of people living with gambling disorder have at least one other mental disorder.
- 6Diagnosed gambling disorder rates have increased by around 60% in US states that have legalized sports betting since 2018.
- 7Just 28% of sports event contract bettors said responsible gaming tools were easy to find, compared with 58% of sportsbook users.
- 8US search interest in problem gambling increased by 84% between 2016 and 2025, while remaining stable in the UK.
- 9Brazil recorded the largest search interest increase in problem gambling of the countries analyzed, rising by 787% between 2016 and 2025.
- 10Massachusetts had the highest problem gambling funding per resident of any US state, at $7.42 per person.
Need help with gambling?
If gambling is causing problems for you or someone close to you, free and confidential support is available. In the US, the National Problem Gambling Helpline can connect you with free support in your state by calling 1-800-MY-RESET.
In Great Britain, the National Gambling Helpline is available 24/7 on 0808 8020 133 in England and Scotland and 0808 2819 265 in Wales. For those elsewhere, Gambling Therapy provides free support internationally.
If you’re experiencing emotional distress or suicidal thoughts, you can call or text the 988 Suicide & Crisis Lifeline in the US on 988. In the UK and Ireland, Samaritans is available on 116 123, 24 hours a day, all year round.
For more information on safer gambling practices and available support, visit our Responsible Gambling page.
Gambling Addiction Statistics Worldwide
Gambling is a global pastime, with 2024 research published in The Lancet Public Health estimating that over 46% of adults worldwide had gambled in the previous 12 months, equating to approximately 2.3 billion people. Additionally, just under 18% of adolescents had gambled over this period, equal to around 159.6 million adolescents between the ages of 10 and 19 years old.
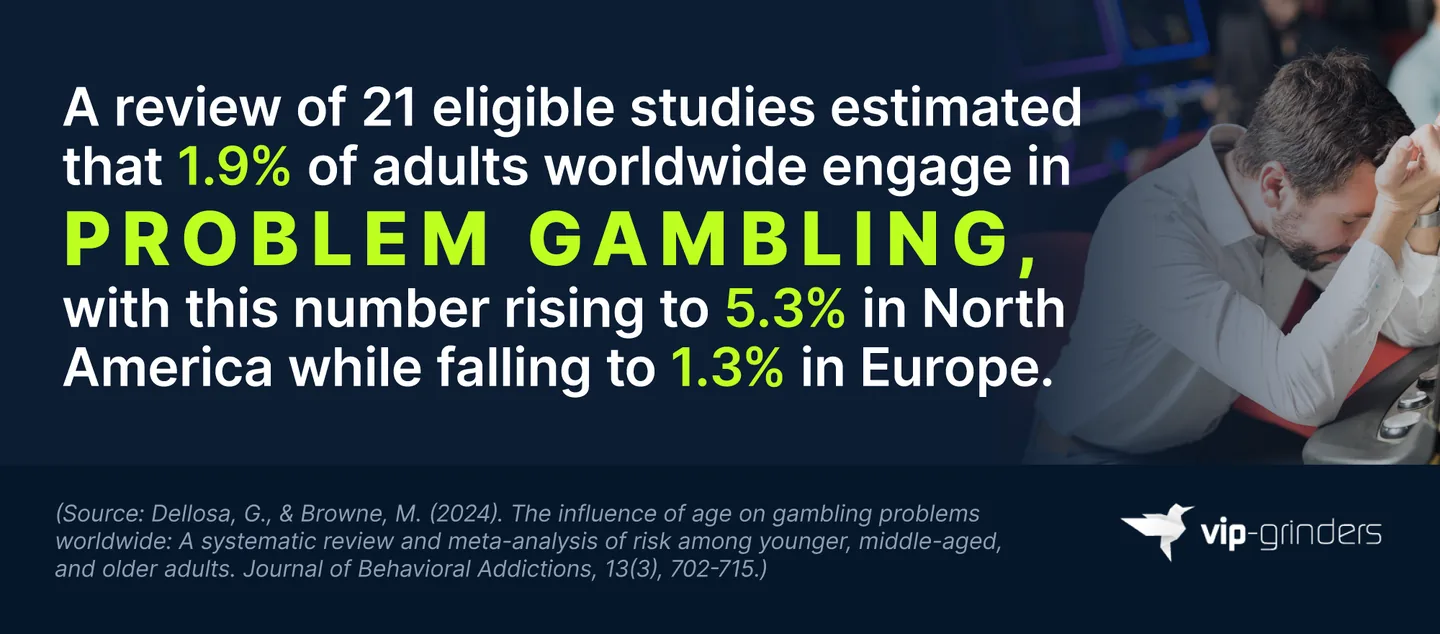
A systematic review of 21 studies in 2024 estimated that 1.9% of adults worldwide experience problem gambling, with this figure rising to 5.3% in North America. In Europe, the prevalence was lower, at 1.3%.
The same analysis found that men were 3.4 times more likely to experience problem gambling than women, while young adults displayed a 1.51 times higher likelihood of reporting problem gambling than middle-aged adults. By comparison, adults in the oldest age group had 0.80 times the likelihood of reporting problem gambling as those of middle age.
How Many People Are Addicted to Gambling?
There is no single definitive figure for how many people worldwide are addicted to gambling, with a range of different definitions and methods used across various studies to track gambling problems.
Additionally, estimates based on reported gambling addiction or harmful gambling do not capture everyone affected, as many people may experience gambling harm without seeking support or recognizing and reporting their behavior as problematic.
A meta-analysis on problem gambling reported that around 1.29% of the world’s adults experienced problem or pathological gambling. It’s worth noting that this differs from the 1.9% ‘problem gambling’ rate from a previously mentioned study, due to differences in methodologies, sample size, and definitions.
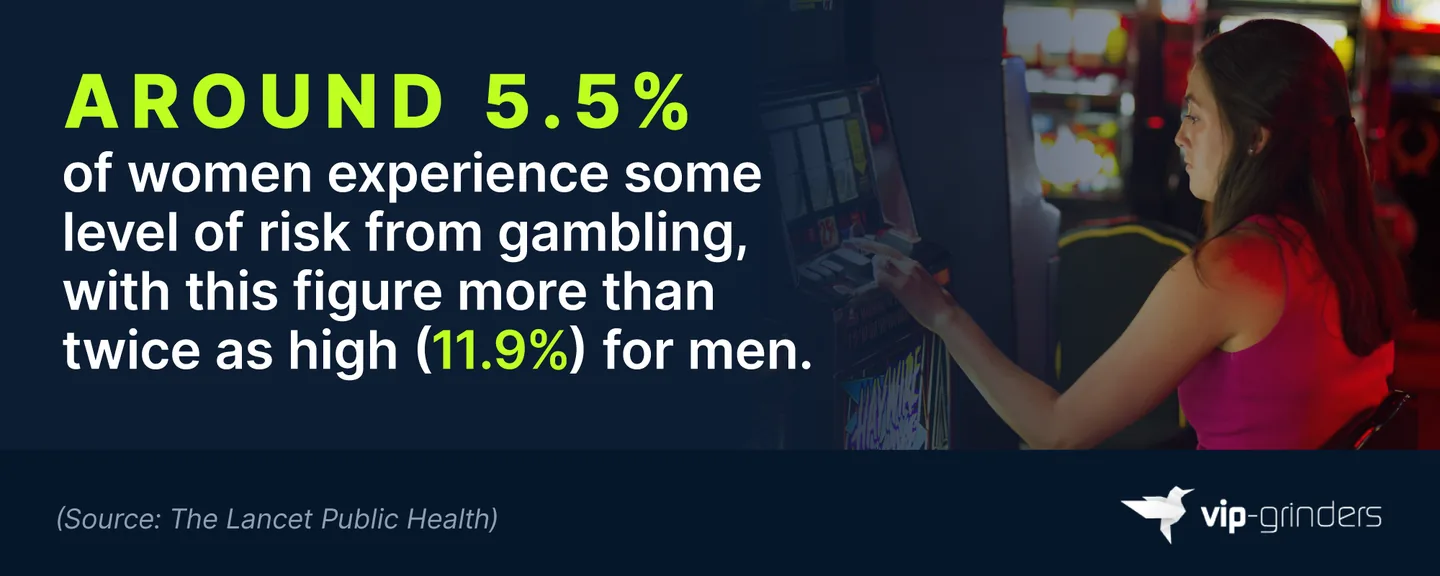
The number experiencing some degree of gambling harm is considerably higher, with global estimates suggesting that 11.9% of men (approximately 308.7 million) and 5.5% of women (approximately 140 million) experience some level of harm from gambling.
Gambling Addiction Statistics in the US
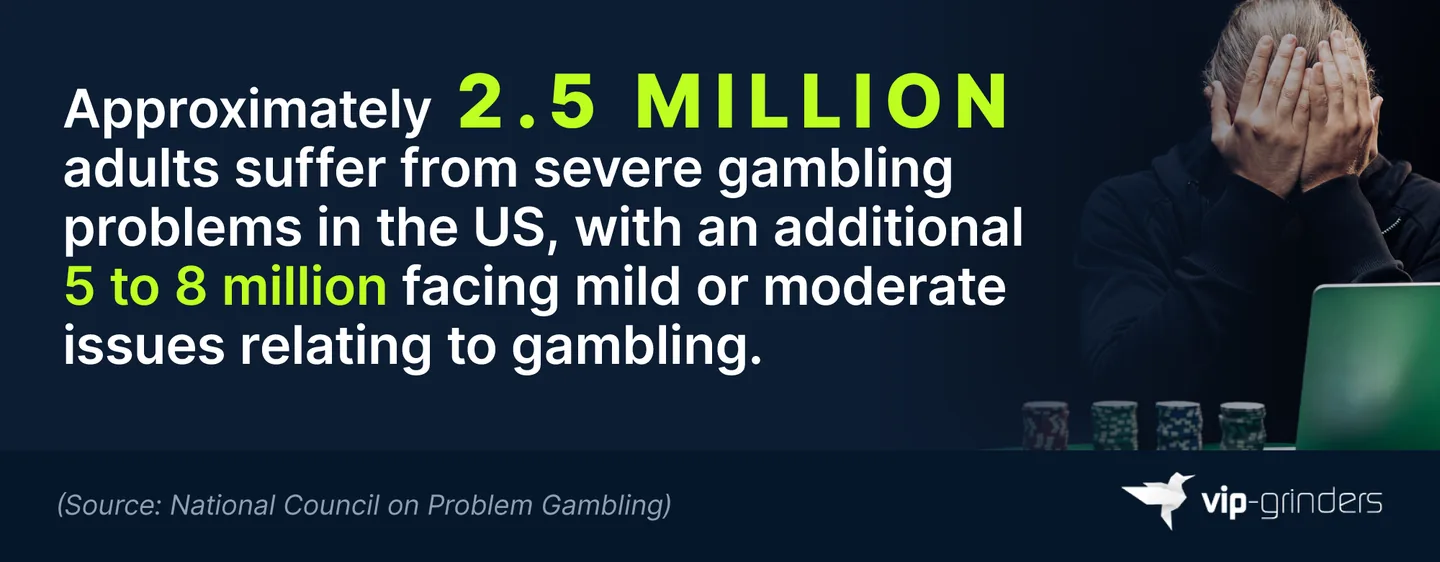
Problem gambling affects millions of people across the United States. The National Council on Problem Gambling (NCPG) estimates that approximately 2.5 million US adults have a severe gambling problem, while between five and eight million experience mild or moderate gambling issues.
21.2% of the 2,000 people surveyed for the VIP-Grinders US Gambling Survey in May 2026 say they always or often hide gambling losses from someone close to them. These findings describe self-reported behavior rather than a clinical measure of gambling addiction or problem gambling.
In the NCPG’s NGAGE 3.0 survey in 2024, 8% of American adults reported experiencing at least one problematic gambling behavior “many times” over the previous year, equal to around 20 million people.
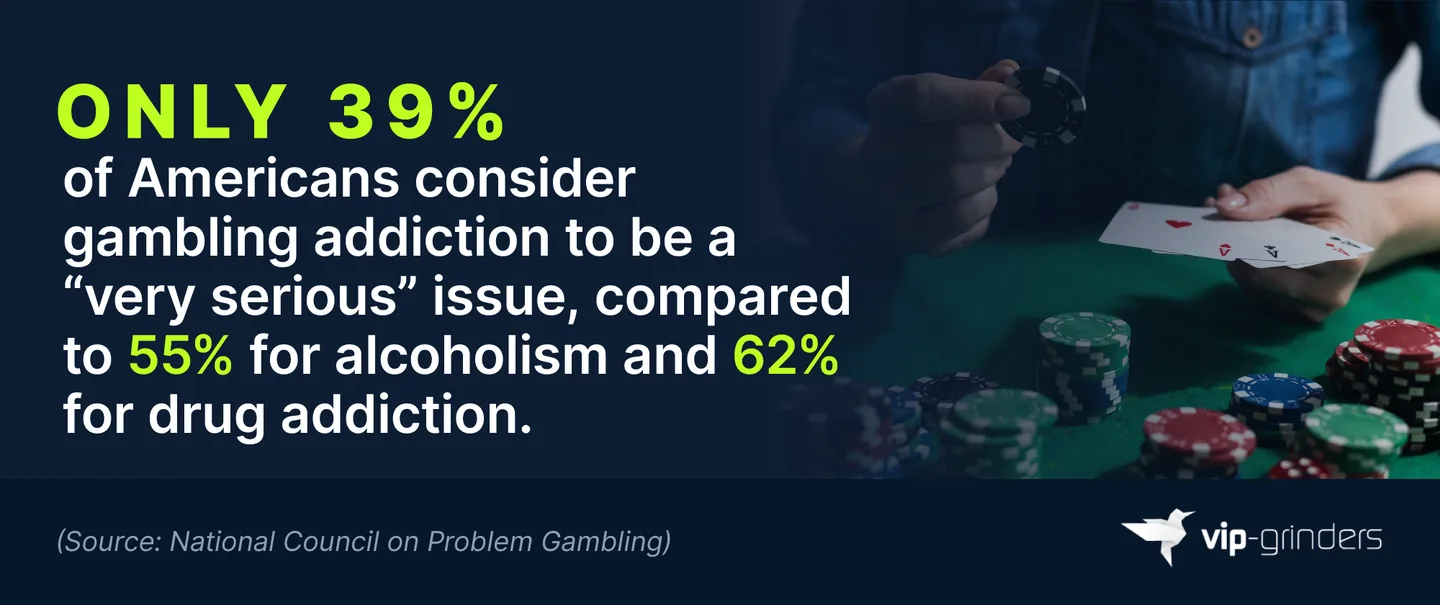
Despite the number of people affected, public perceptions of gambling addiction and problem gambling differ considerably from other highly publicized types of addiction. Just 39% of Americans surveyed consider gambling addiction to be “very serious” compared to 55% for alcoholism and 62% for drug addiction.
Skepticism around treatment options is also high, with 37% of people engaging in risky gambling habits considering recovery “unlikely,” which was more than double the total of the general gambling population. This suggests that negative perceptions around the possibility of recovery may be particularly prominent among those experiencing problematic gambling behaviors.
Gambling Addiction Statistics in Great Britain
The UK gambling addiction statistics in this section cover Great Britain (England, Scotland, and Wales) or England alone, so they exclude Northern Ireland.
The Gambling Commission’s Gambling Survey for Great Britain (GSGB) estimates suggest that 2.4% of adults aged 18 and over had a score of eight or higher on the Problem Gambling Severity Index (PGSI) in 2025, a level categorized as problem gambling.
The PGSI measures gambling-related problems using a scale of 0 to 27, with respondents grouped into the following four categories:
- 0: Person experiencing no reported problems from gambling
- 1 to 2: Low-risk gambling
- 3 to 7: Moderate-risk gambling
- 8+: Person experiencing a high level of problems from gambling
A further 3.5% of adults scored between three and seven, placing them in the moderate-risk category, while 7.8% of adults had a score between one and two, indicating low-risk gambling.
This means that 13.7% of adults in Great Britain had a PGSI score of one or more, according to GSGB’s estimates.
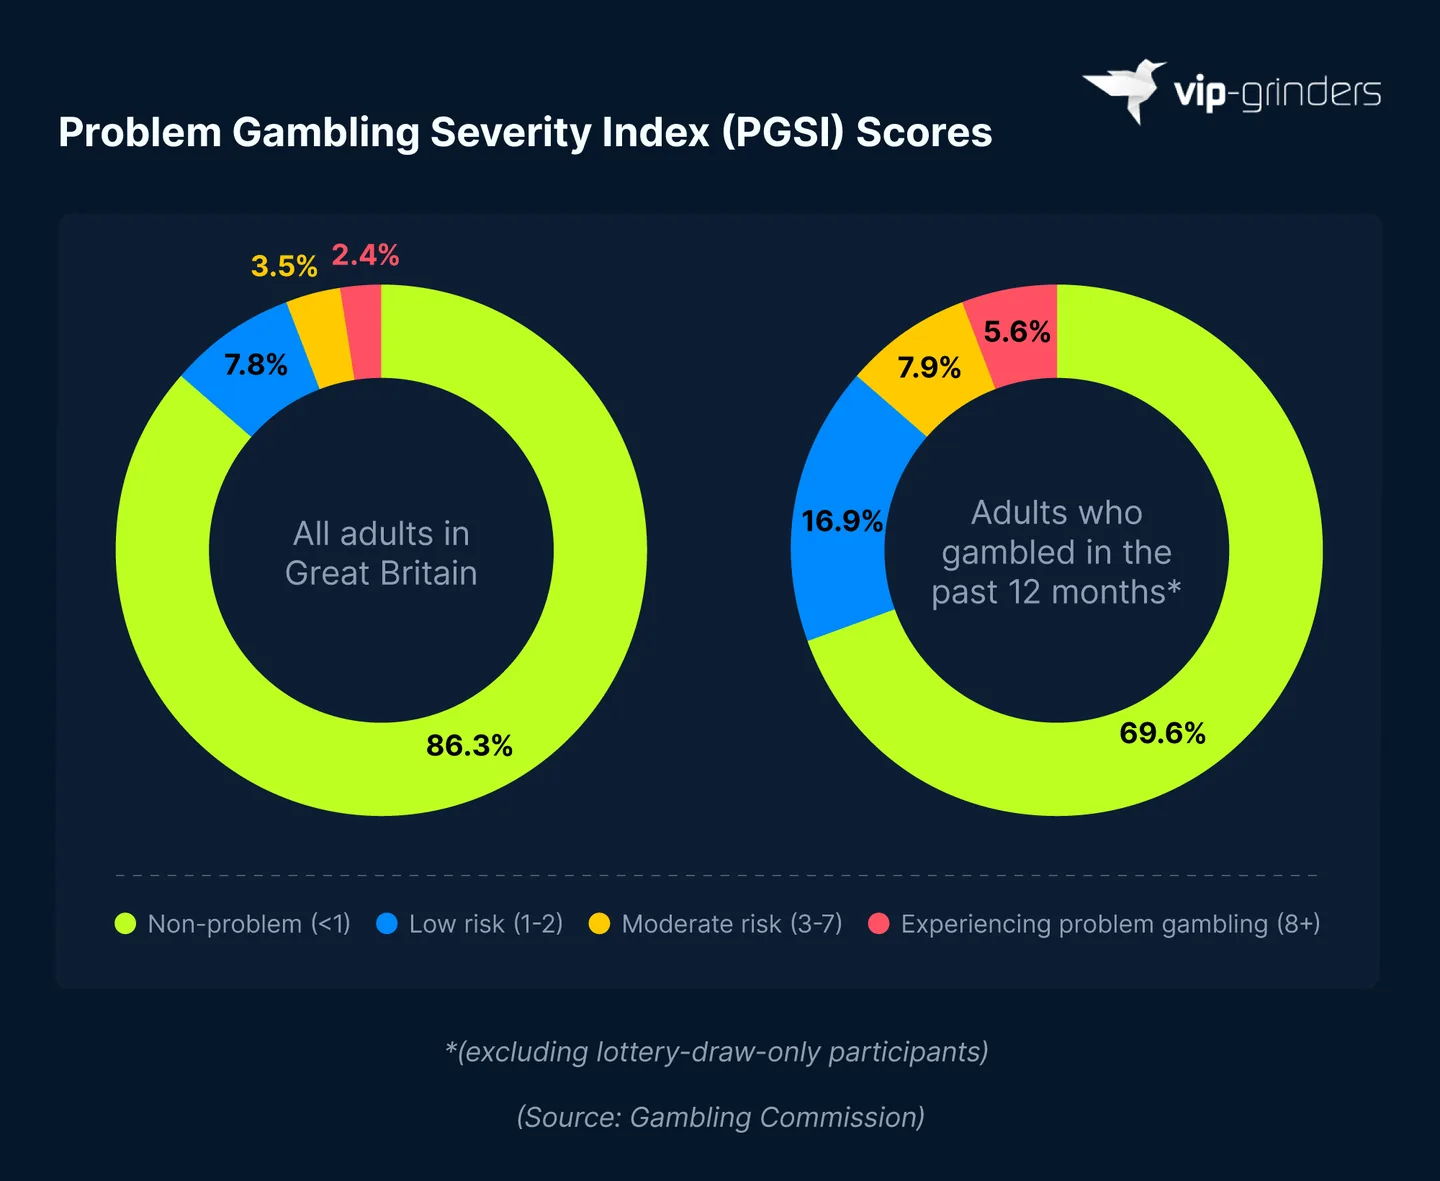
Estimates were higher when looking at British adults who gambled in the past 12 months. 5.6% of adults who had participated in gambling during that period had a PGSI score of 8 or more, when excluding lottery draw-only products. This is more than double the total for the wider general public.
A further 7.9% of adults who had gambled in the past year had a PGSI score between three and seven, placing them at moderate risk, with 16.9% recording a PGSI score between one and two.
Combined, an estimated 30.4% of people who gambled in the previous year, excluding those whose only gambling was lottery draw products, recorded a PGSI score of at least one.
Gambling Addiction Statistics in England by Year
NHS England’s Health Survey for England tracks gambling in England by year and across demographics, including data on PGSI scores.
However, its results should not be compared with figures from the Gambling Survey for Great Britain. As well as covering different populations (England compared with Great Britain), the surveys use different methodologies, which the Gambling Commission warns can produce different estimates of the prevalence of certain PGSI scores.
Data from the HSE shows that 48% of adults aged 16 and over in England participated in some form of gambling over the previous year in 2024. This marked a fall from 2018 when the total stood at 54%, which in itself was a decline from 65% in 2012.
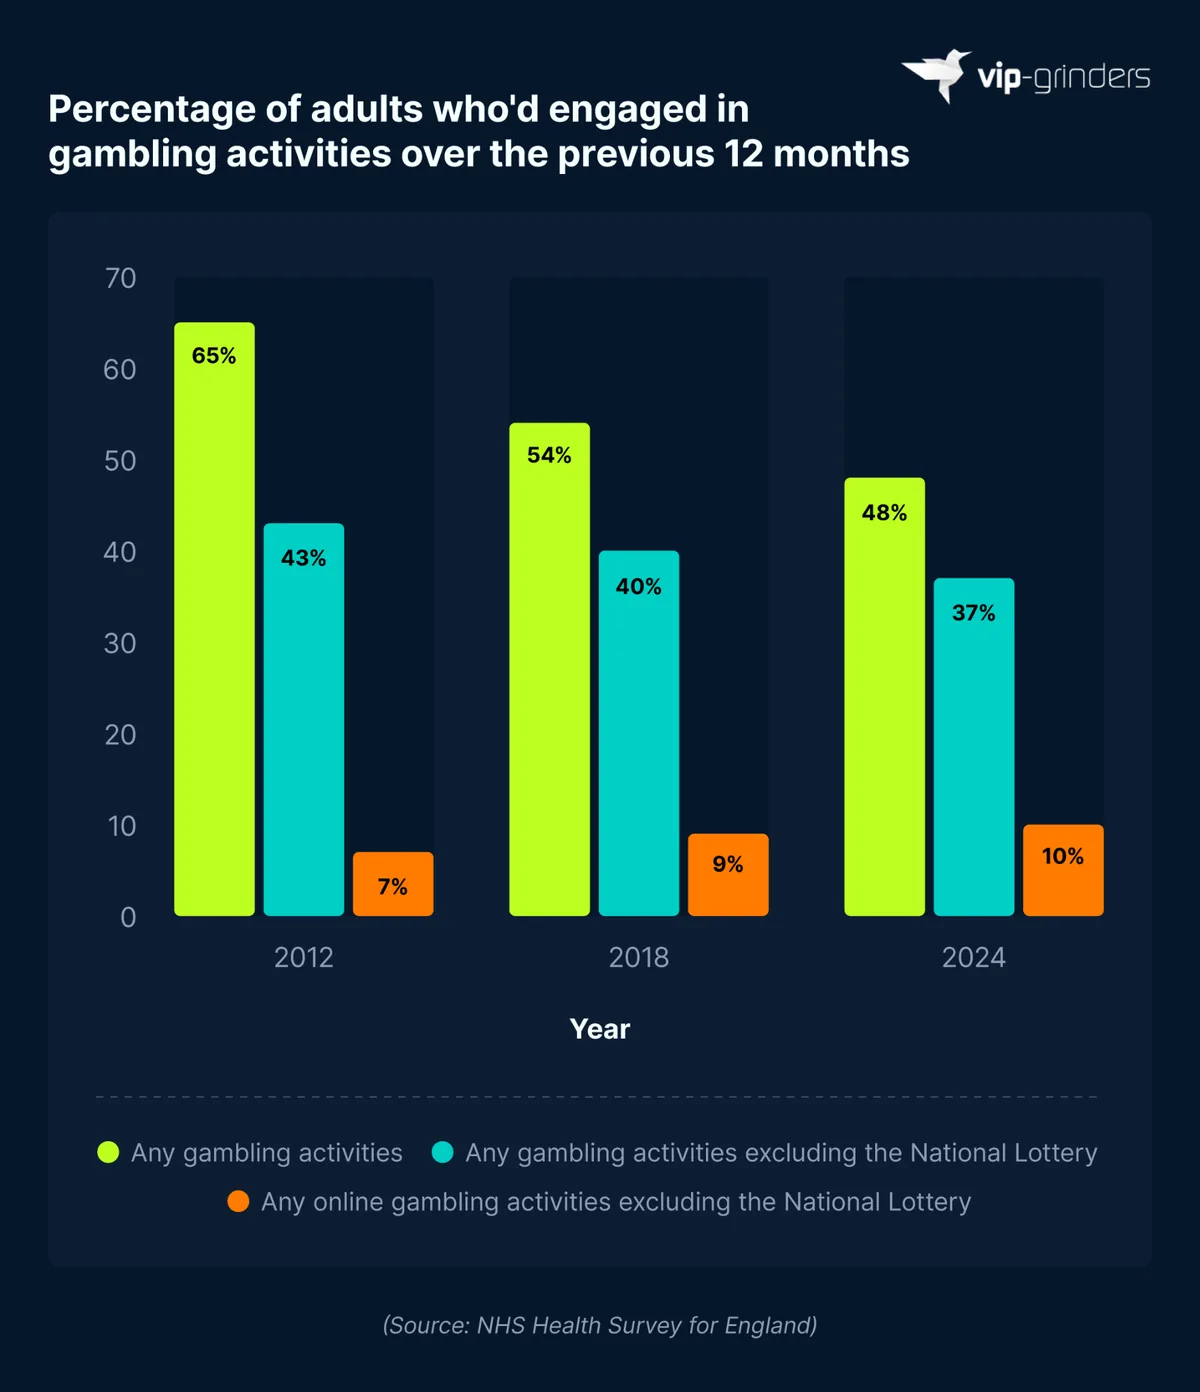
At the same time, the number of people betting, excluding the National Lottery, fell from 43% in 2012 to 37% by 2024.
Online gambling participation went in the opposite direction, with rates rising from 7% in 2012 to 9% in 2018 and then 10% in 2024, suggesting a transition toward online gambling despite overall rates reducing.
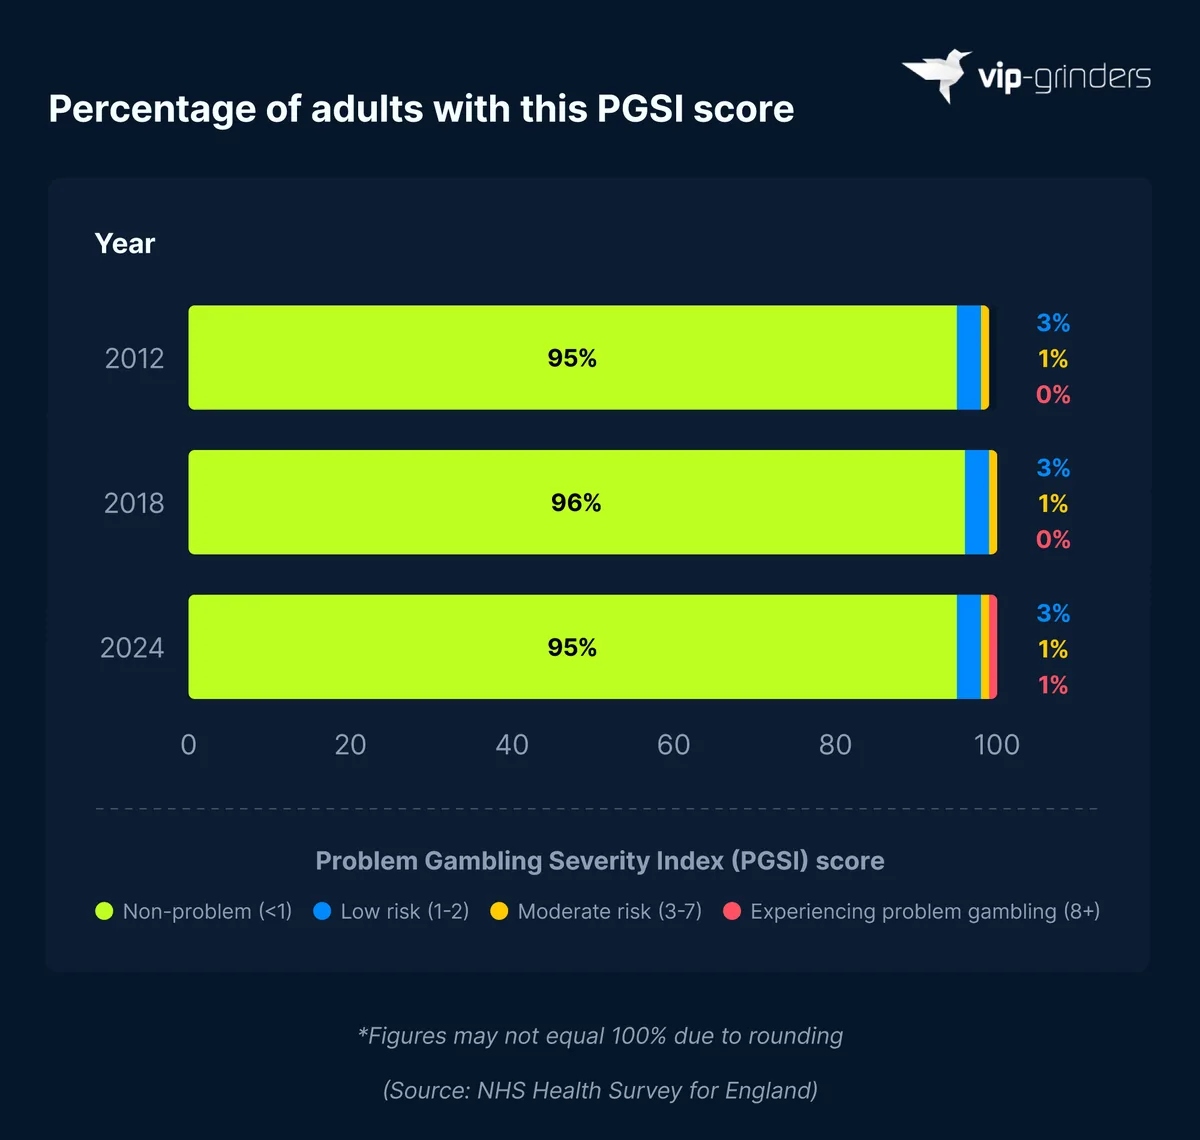
The majority of adults in NHS England’s Health Survey for England reported no problems from gambling, with 95% recording a PGSI score of 0. This figure is slightly lower than the total for 2018 (96%) and identical to 2012.
This means that 5% of people interviewed met the criteria for being at risk of experiencing an adverse consequence from gambling, up from 4% in 2018. Just 1% were categorized as experiencing problem gambling in 2024 (PGSI score of 8 or more), compared with less than 1% when the figures were rounded to the nearest whole percentage in 2018 and 2012. It’s worth noting that the 2024 total was rounded up from around 0.66%, whereas the 2012 and 2018 figures were rounded down from approximately 0.35%.
Gambling Addiction Demographics Statistics in Great Britain
Gambling Risk by Ethnicity
Problem gambling statistics from the Gambling Survey for Great Britain found that 9.2% of white people who’d gambled in the previous 12 months had experienced one or more adverse consequences in 2025.
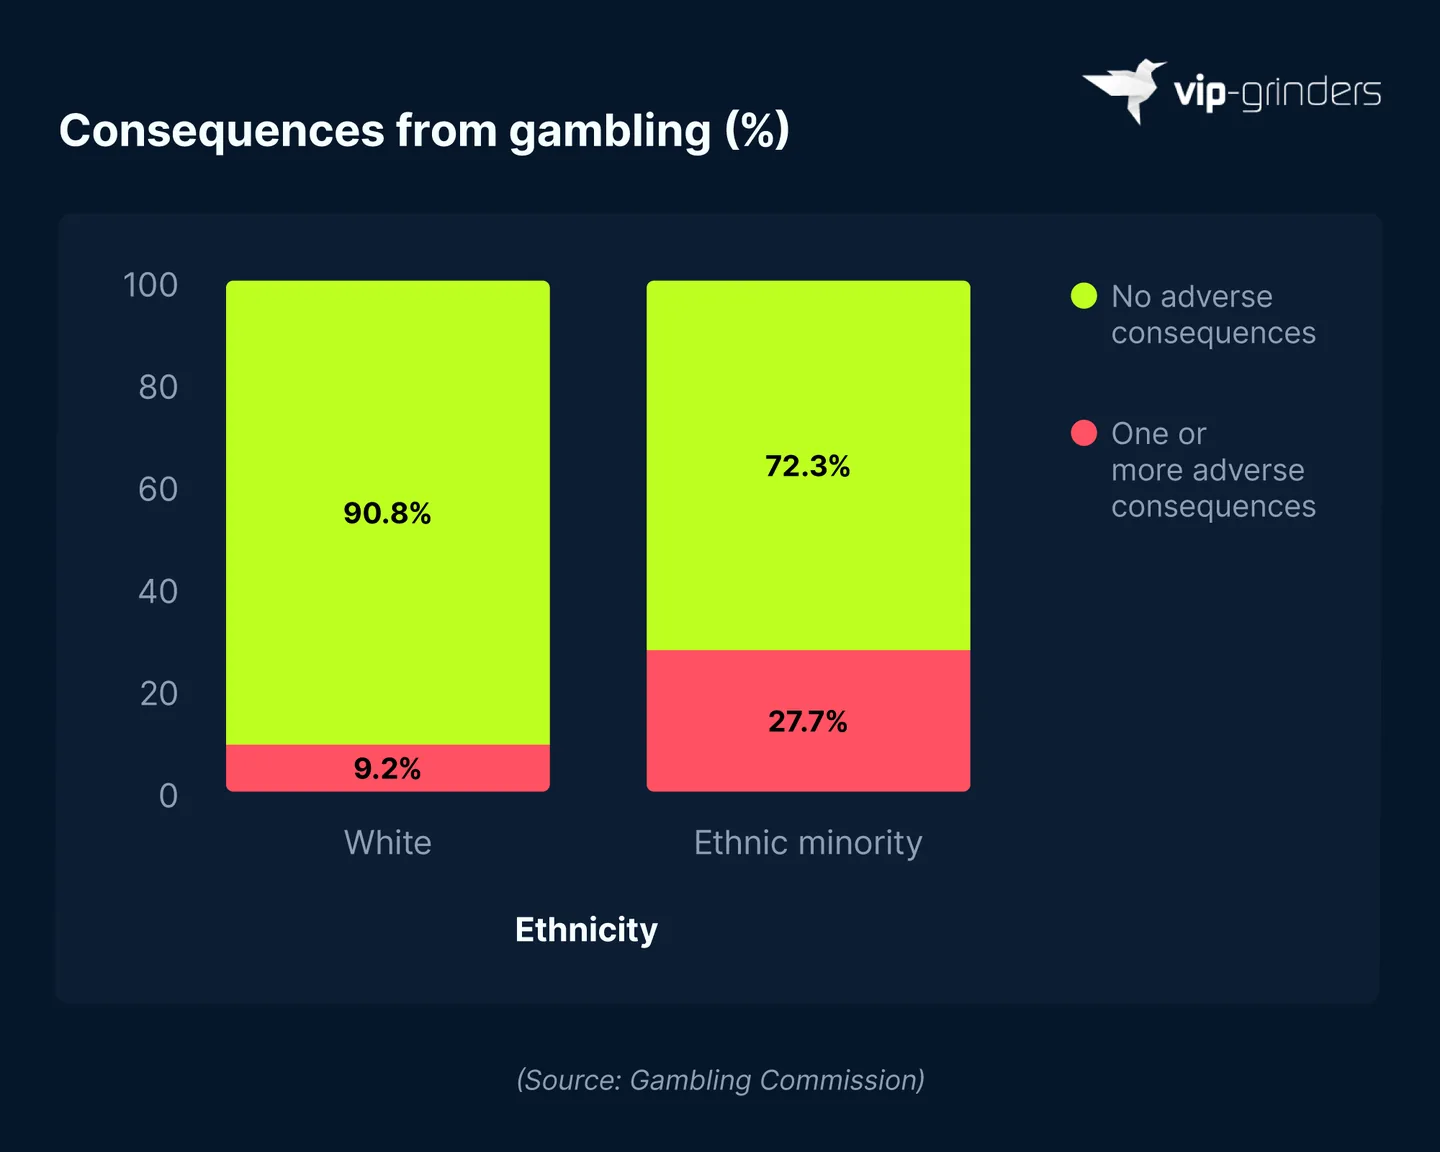
By comparison, 27.7% of people who gambled from ethnic minority backgrounds reported at least one adverse consequence, over triple the total for white people.
Gambling Risk by Household Income
Adults from lower-income households were more likely to experience negative effects from gambling in Great Britain, with 15% of past-year gamblers in the lowest income bands reporting at least one adverse consequence.
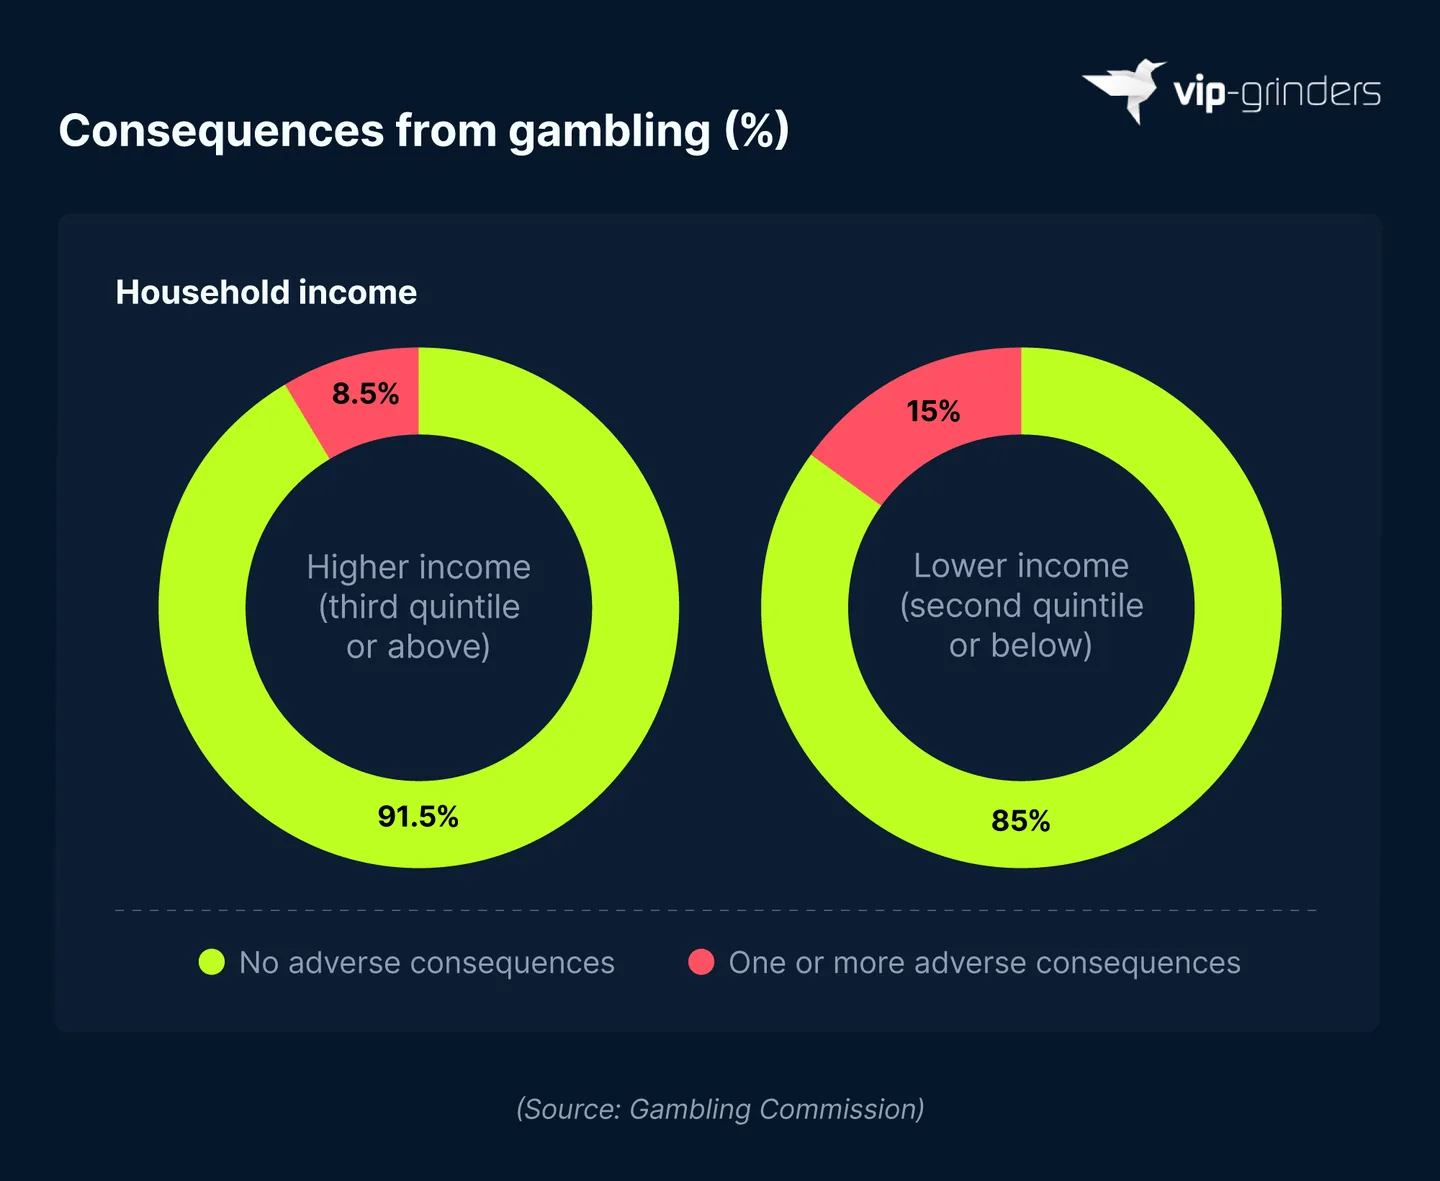
This number fell to 8.5% among the higher household income groups, meaning adverse consequences from gambling were almost twice as common in lower-income households.
Gambling Risk by Educational Level
In Great Britain, over one in 10 (10.4%) past-year gamblers with higher education qualifications experienced one or more adverse consequences from gambling in 2025.
Rate of adverse consequences among those who gambled in the past year by educational level, 2025
| Higher education qualification | No adverse consequences from gambling | One or more adverse consequences from gambling |
|---|---|---|
| Yes | 89.6% | 10.4% |
| No | 84.1% | 15.9% |
(Source: Data from the Gambling Commission’s Gambling Survey for Great Britain 2025, Adverse consequences from gambling: Further insights from the Gambling Survey for Great Britain 2025)
This rose to 15.9% among those without a higher educational qualification.
Gambling Addiction Prevalence by Age
The latest report from the HSE found the number of people who may be at risk of adverse consequences if they are heavily involved in gambling (a PGSI score of one or more) generally declined with age. An estimated 9% of people aged 16 to 24 had a PGSI score of one or more, compared with just 1% of those aged 65 to 74 and 75 and over. It’s worth noting that the individual PGSI score categories of 1 to 2, 3 to 7, and 8+ for those aged 16 to 24 add up to 8%, rather than 9%, due to rounding in the published figures.
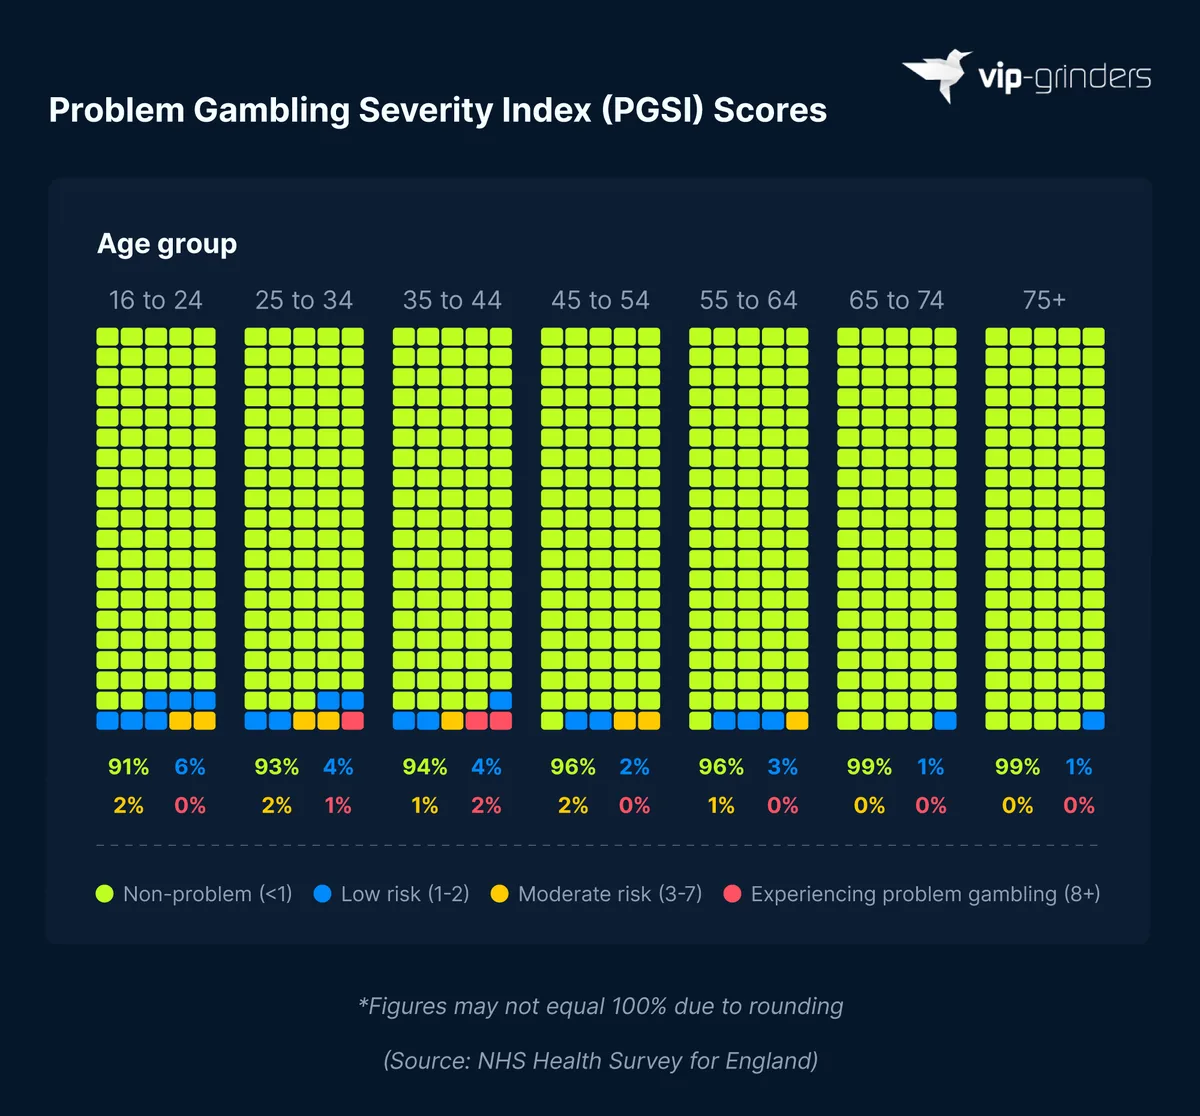
Despite 16-to-24-year-olds having the most people at risk from gambling, it was the 35 to 44 age group that had the most adults with a PGSI score of 8 or more, with 2% in this age group being in this category.
Moderate-risk gambling scores were highest among ages 16 to 24, 25 to 34, and 45 to 54, with each group recording 2%. By comparison, this level of gambling was lowest in the oldest age groups, rounding to less than 1% in both the 65 to 74 and 75-and-over age groups.
Problem Gambling Prevalence by Gender
Gambling addiction statistics estimate that 7% of men in England recorded a PGSI score of one or above in 2024, meaning 93% did not display any signs of at-risk gambling, which is down from 94% in 2018.
The 2024 Health Survey for England samples a cross-section of adults in England. In other words, people who do not gamble will be included in the figures.
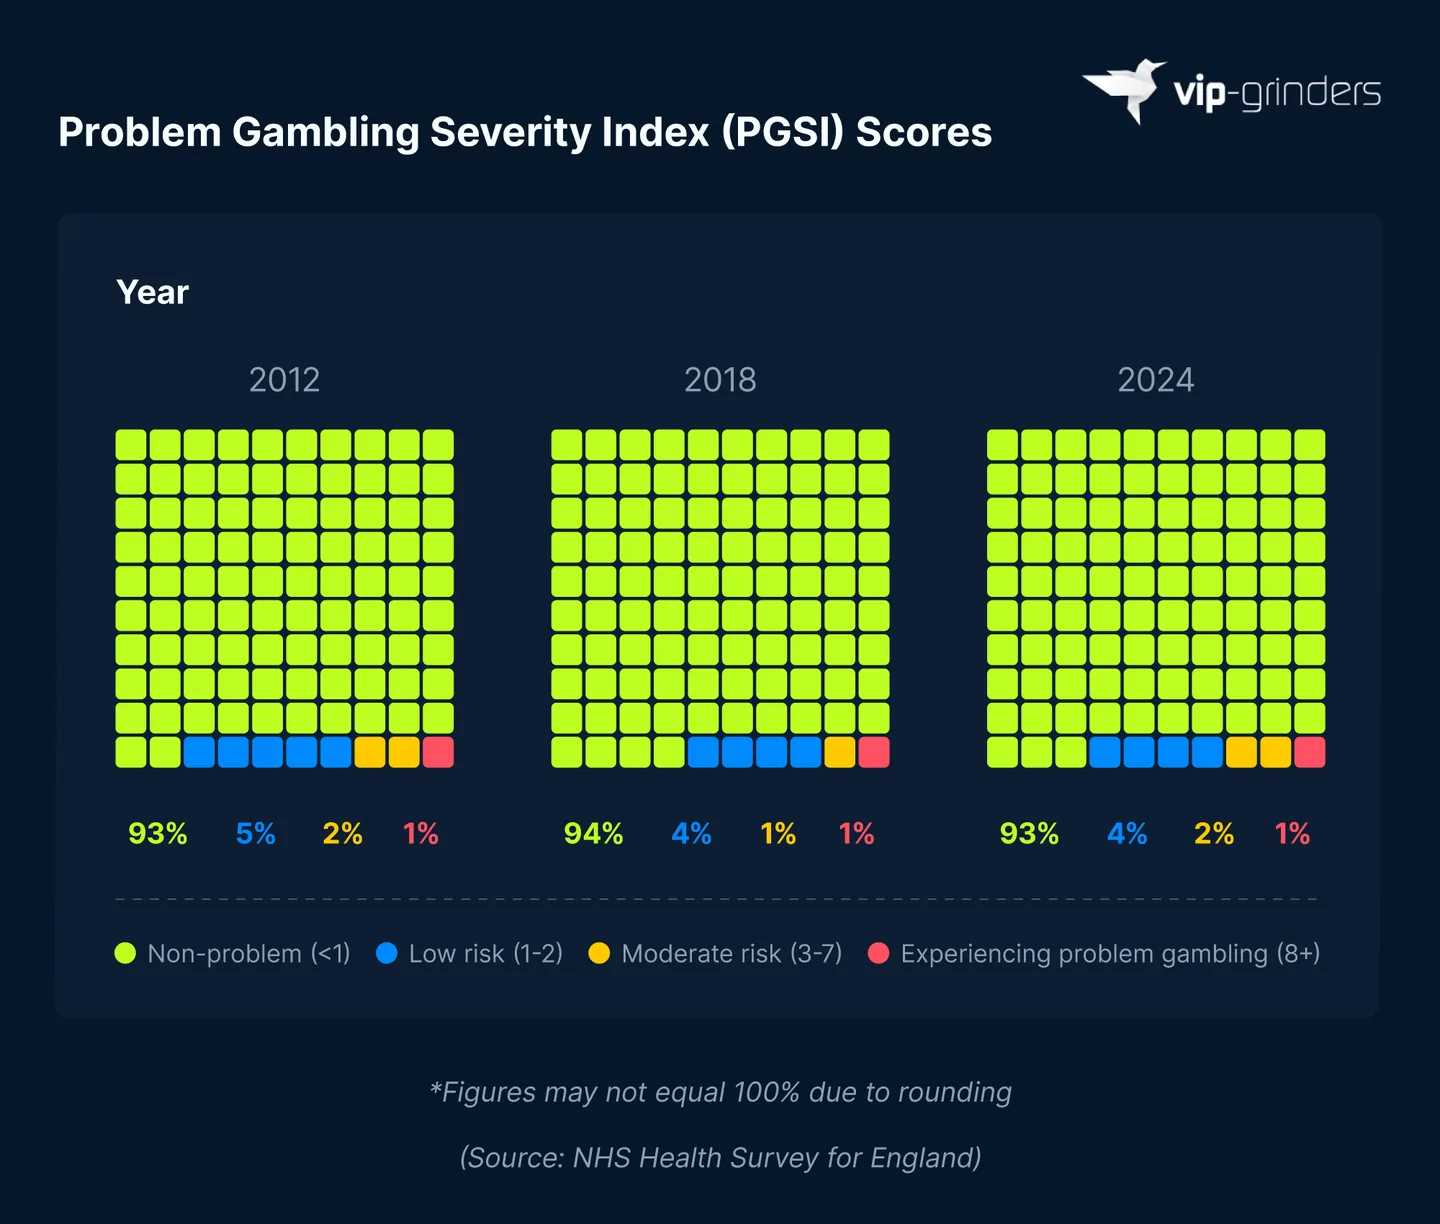
The number of people in the low-risk category remained steady between 2018 and 2024, at 4%. However, this represents a small drop from 2012, when the total stood at 5%.
Meanwhile, the number of people categorized as experiencing problem gambling in the HSE study has remained consistent at around 1% between 2012 and 2024.
Problem Gambling Severity Index scores among women in England by year
| PGSI score | 2012 | 2018 | 2024 |
|---|---|---|---|
| No problem gambling (score of less than 1) | 98% | 98% | 97% |
| Low risk (score of between 1 and 2) | 2% | 1% | 2% |
| Moderate risk (score between 3 and 7) | 0% | 0% | 0% |
| Experiencing problem gambling (score of 8 or above) | 0% | 0% | 0% |
(Source: Data from the NHS Health Survey for England, 2024, Adults Health Related Behaviours)
*Figures may not equal 100% due to rounding
Just 3% of women in England recorded PGSI scores of one or above in the HSE’s 2024 survey, slightly more than the rounded figures for the individual risk categories suggest, compared with 7% of men.
The total number of women falling into the moderate risk and problem gambling categories was below 1% in 2024, with both categories rounding to 0% in the published figures.
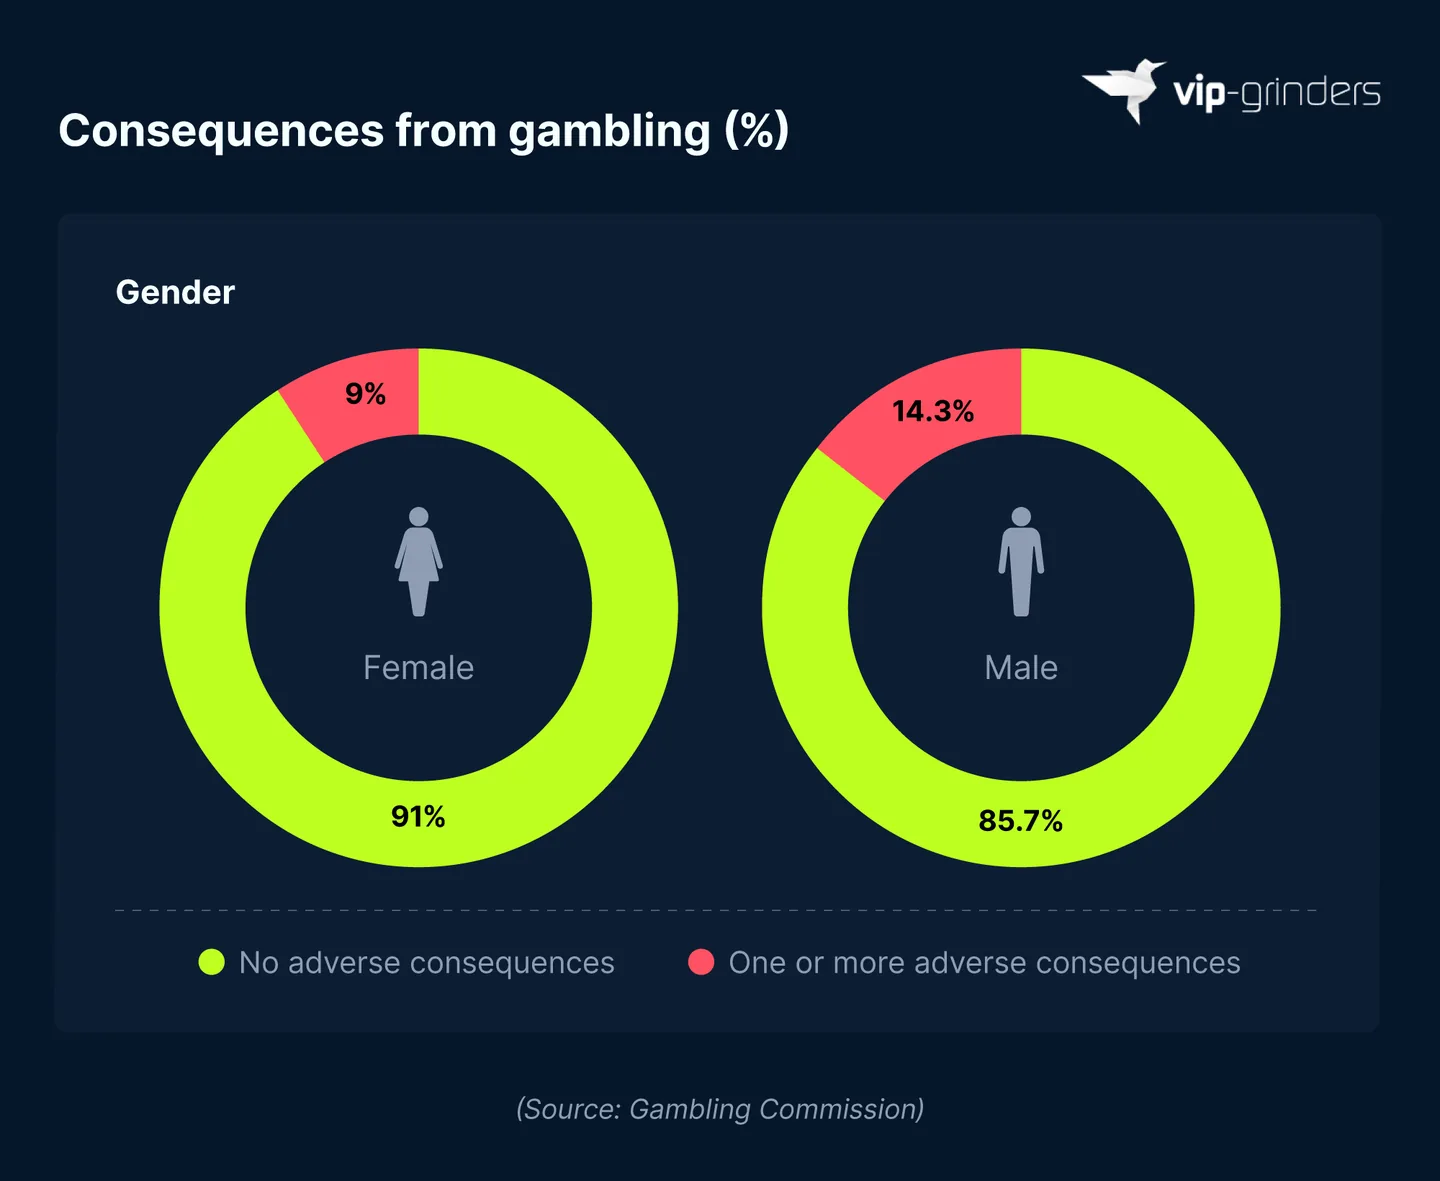
Men in Great Britain who’d gambled within the previous 12 months were more likely to have experienced adverse consequences than women who did the same. Over 14% of men reported at least one adverse consequence from gambling, compared to just 9% of women.
This suggests that the gender gap extends beyond gambling prevalence, with men also more likely to experience negative consequences from their gambling.
As the data only includes people who gambled within the previous 12 months, men’s higher overall gambling participation cannot be considered the sole reason for the differences in adverse consequences between genders.
Though men may gamble more regularly overall, the VIP-Grinders’ Women in Gambling Statistics page reported that 39% of women experiencing problem gambling who would not seek treatment cited embarrassment as a reason. This statistic, taken from GambleAware research, highlights the need for problem gambling messaging and support that effectively reaches both genders.
João Mourato, Head of iGaming Product at VIP-Grinders, commented on the importance of addressing this issue:
“These figures show why problem gambling messaging cannot take a one-size-fits-all approach. Men may be more likely to experience adverse consequences from their gambling, but stigma can create a significant barrier to women seeking support. Awareness campaigns and treatment services need to consider these different experiences to ensure their messaging reaches people of both genders effectively.”
Gambling Addiction Prevalence by Region
Though gambling risk varied across English regions in the 2024 Health Survey for England, the differences were not significant. Yorkshire and the Humber recorded the highest proportion of adults with a PGSI score of one or above, at 7%, followed by the North East, South East, and South West at 6% each.
The East Midlands recorded the lowest proportion of adults experiencing any level of risk, at 3%, while London placed fifth with 5%.
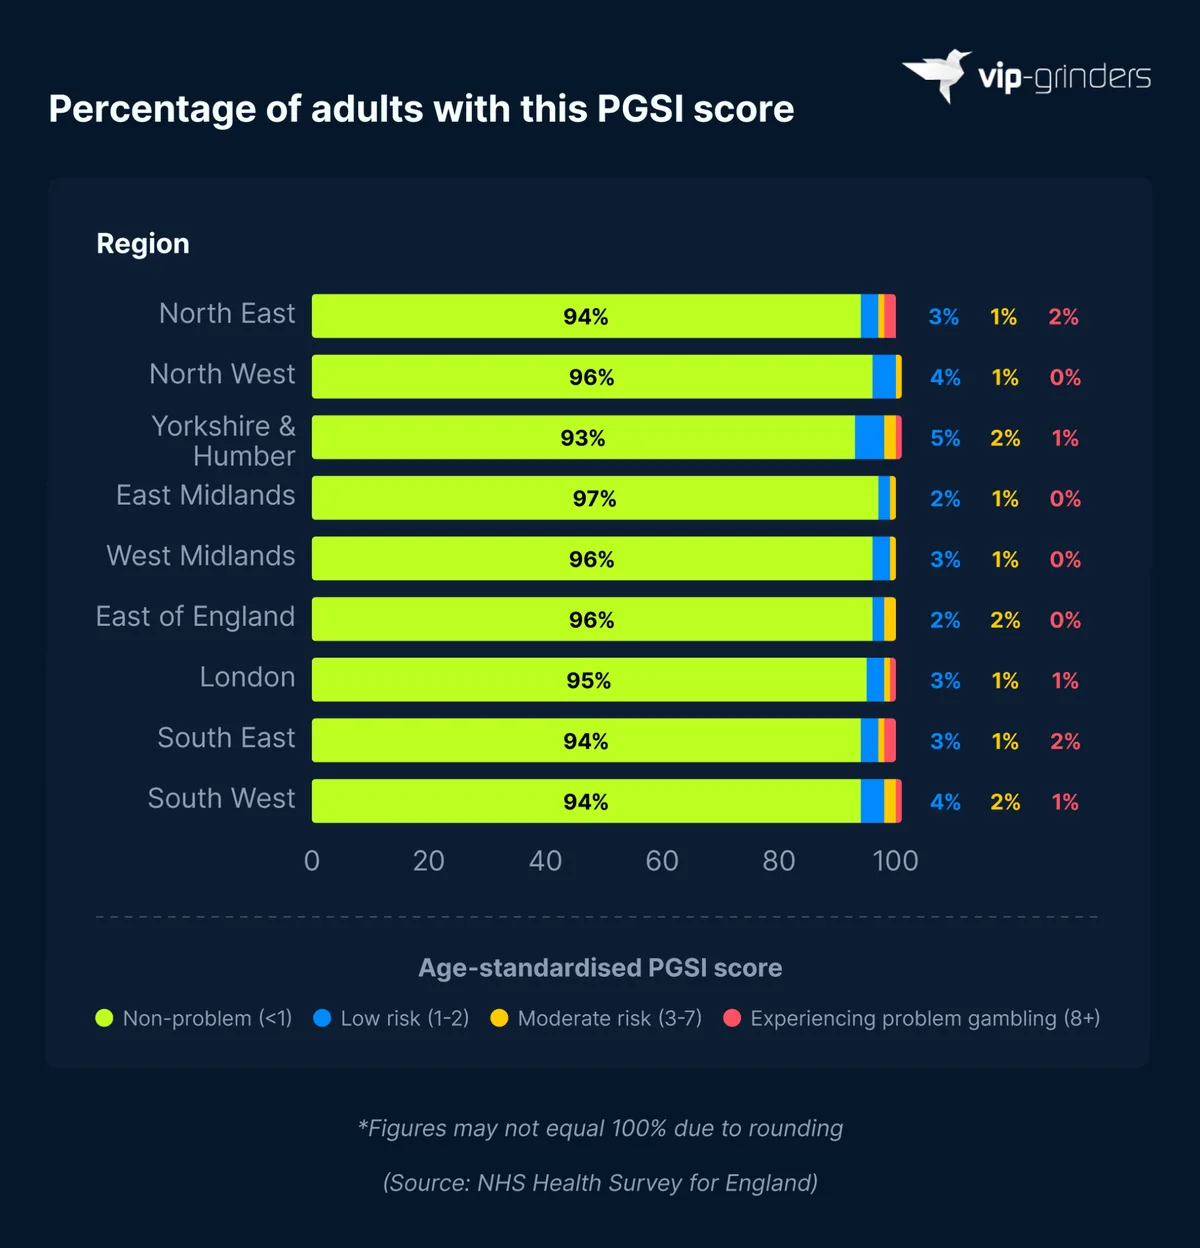
The regional picture differed slightly when looking specifically at the most severe PGSI category. Problem gambling (a score of eight or above) was highest in the North East and South East at 2%, despite both having a lower overall percentage of people experiencing gambling risk than Yorkshire and the Humber.
This is because most of Yorkshire and the Humber’s higher overall rate was concentrated in the lower risk categories. Around 5% of adults recorded a PGSI score of one to two, compared to just 3% in the North East and South East.
Gambling Activities Among Those Experiencing Adverse Consequences
Gambling Commission data compared participation in different gambling activities among adults who had experienced adverse consequences and those who had experienced none, looking at activities played in the previous four weeks among those who had gambled in the past year.
Almost two in five (39.5%) adults who’d experienced one or more adverse consequences had played scratchcards in the previous four weeks, compared to 18.3% of those who experienced none.
Similar differences were present in sports betting, with 33.7% of adults with at least one adverse consequence having placed a sports bet in the previous four weeks, compared with 14% of those reporting no adverse consequences.
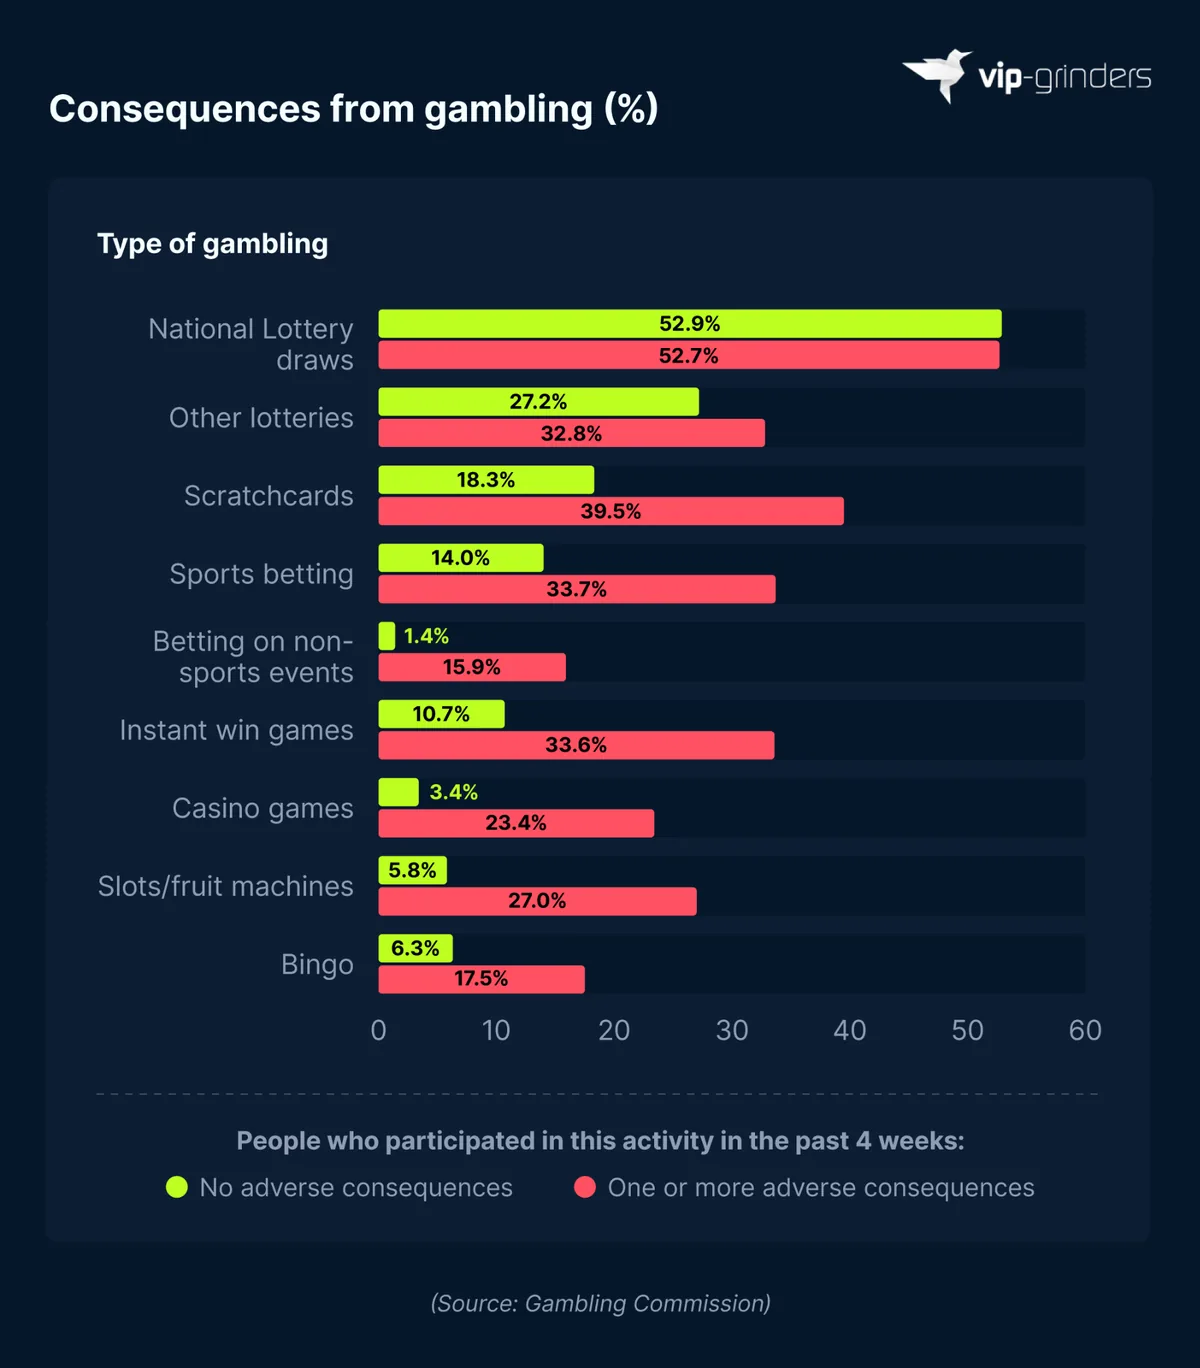
The differences were further pronounced for non-sports event betting and casino games. Non-sports event betting participation stood at 15.9% among those experiencing adverse consequences, compared with just 1.4% of those experiencing none, with a similar disparity found in casino games (23.4% vs 3.4%).
By contrast, there was a much smaller difference in national lottery participation among both groups. Despite having the highest rate in both groups, 52.7% of those experiencing adverse consequences had played National Lottery draws in the previous four weeks, which was slightly lower than the 52.9% recorded among those experiencing none.
Problem Gambling Rates by Type of Gambling Activity
Among people who had gambled in the previous 12 months, those who bet on event outcomes in person had the highest rate of problem gambling in Great Britain in 2025.
Over 40% of people who participated in this type of betting over the previous year recorded a PGSI score of eight or above. This was over 10 percentage points more than any other gambling activity, making in-person betting on event outcomes the only one where more than 30% of past-year participants experienced problem gambling.
Rate of problem gambling among those who gambled in the past year in Great Britain by activity, 2025
| Gambling activity | Percentage of participants with a PGSI score of 8+ |
|---|---|
| Any gambling | 4.0% |
| Casino games1 (all) | 18.7% |
| Casino games at a casino | 21.5% |
| Casino games on a machine/terminal in a venue | 28.7% |
| Casino games online/via an app | 22.7% |
| Fruit and slots games1 (all) | 15.4% |
| Fruit and slots in person | 14.4% |
| Fruit and slots online/via an app | 21.3% |
| Bingo (all)1 | 10.7% |
| Bingo at a venue | 8.8% |
| Bingo online/via an app | 20.5% |
| Betting (all)1 | 8.9% |
| Sports/racing betting in person | 13.4% |
| Sports/racing betting online/via an app | 8.9% |
| Betting on the outcome of events in person | 40.4% |
| Betting on the outcome of events online/via an app | 22.7% |
| Scratchcards1 | 7.1% |
| National Lottery scratchcards | 7.0% |
| Other scratchcards bought in person | 12.6% |
| Online instant-win games (all) | 10.1% |
| National Lottery online instant-win games | 8.6% |
| Other online instant-win games | 17.9% |
| National Lottery draws1 | 3.7% |
| Other charity lottery draws | 4.3% |
| Football pools1 | 22.6% |
| Private betting1 | 12.8% |
(Source: Data from the Gambling Commission’s Gambling Survey for Great Britain (Annual Report 2025): Official statistics)
1Includes both online and in-person gambling
Casino games played on a machine or terminal in a venue (e.g., casino, sportsbook, club, or pub) had the second-highest rate, with 28.7% of participants recording a PGSI score of at least eight. This was the only other activity where more than a quarter of past-year participants experienced problem gambling.
Rates were also particularly high among those who bet on outcomes of events online or via an app and those who played online casino games, at 22.7% each.
At the other end of the scale, just 3.7% of those who entered the National Lottery draw in the previous year met the criteria for problem gambling. This was the lowest of any gambling activity in the study, and the only one to fall below the collective problem gambling rate of 4% among past-year gamblers.
For more information on industry trends across specific gambling activities, explore our Casino Statistics and Poker Statistics reports.
Gambling Addiction Prevalence by Level of Deprivation
Those living in the most deprived areas in England were over three times more likely to experience problem gambling than those in the least deprived areas, according to Gambling Commission data. In 2025, 4.5% of people living in the most deprived areas recorded a PGSI score of eight or above, compared to just 1.2% in the least deprived places.
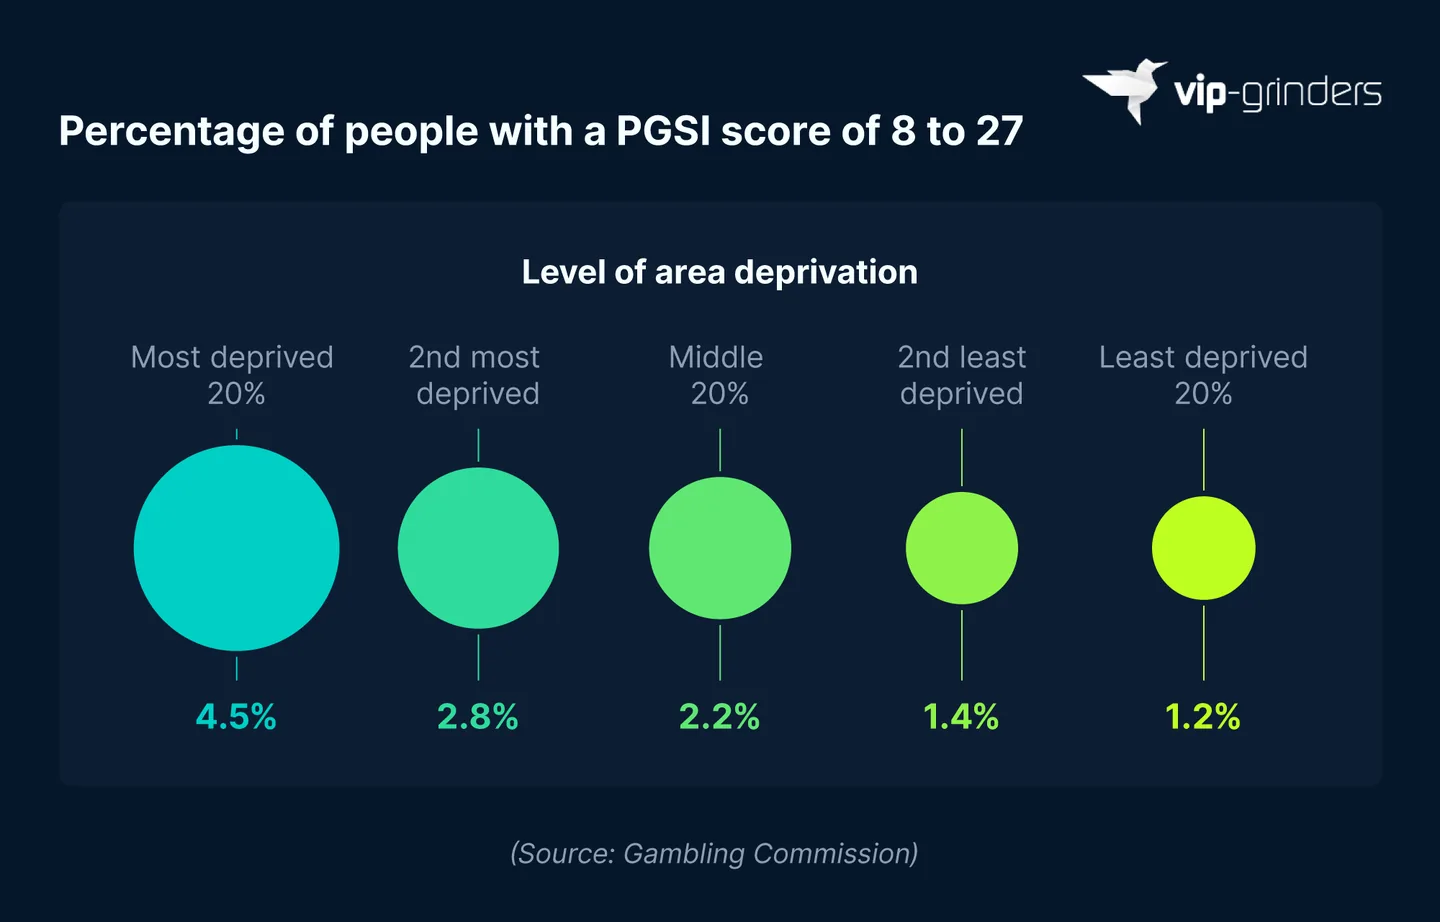
The relationship between area deprivation and problem gambling was visible throughout the data. In the second least deprived area, 1.4% recorded a PGSI score of eight or above, with this figure rising to 2.2% in the middle group.
This increased further to 2.8% for those living in the second-most deprived areas before surpassing 4% in the most deprived places.
Online Gambling Addiction Statistics
A global systematic review and meta-analysis of peer-reviewed and gray literature was published by The Lancet Public Health in 2024. It estimated that 15.8% of adults who played online casino games or slots engaged in problem gambling over the previous 12 months, the most of any activity in the study. By comparison, the global estimate across all adults was 1.4%.
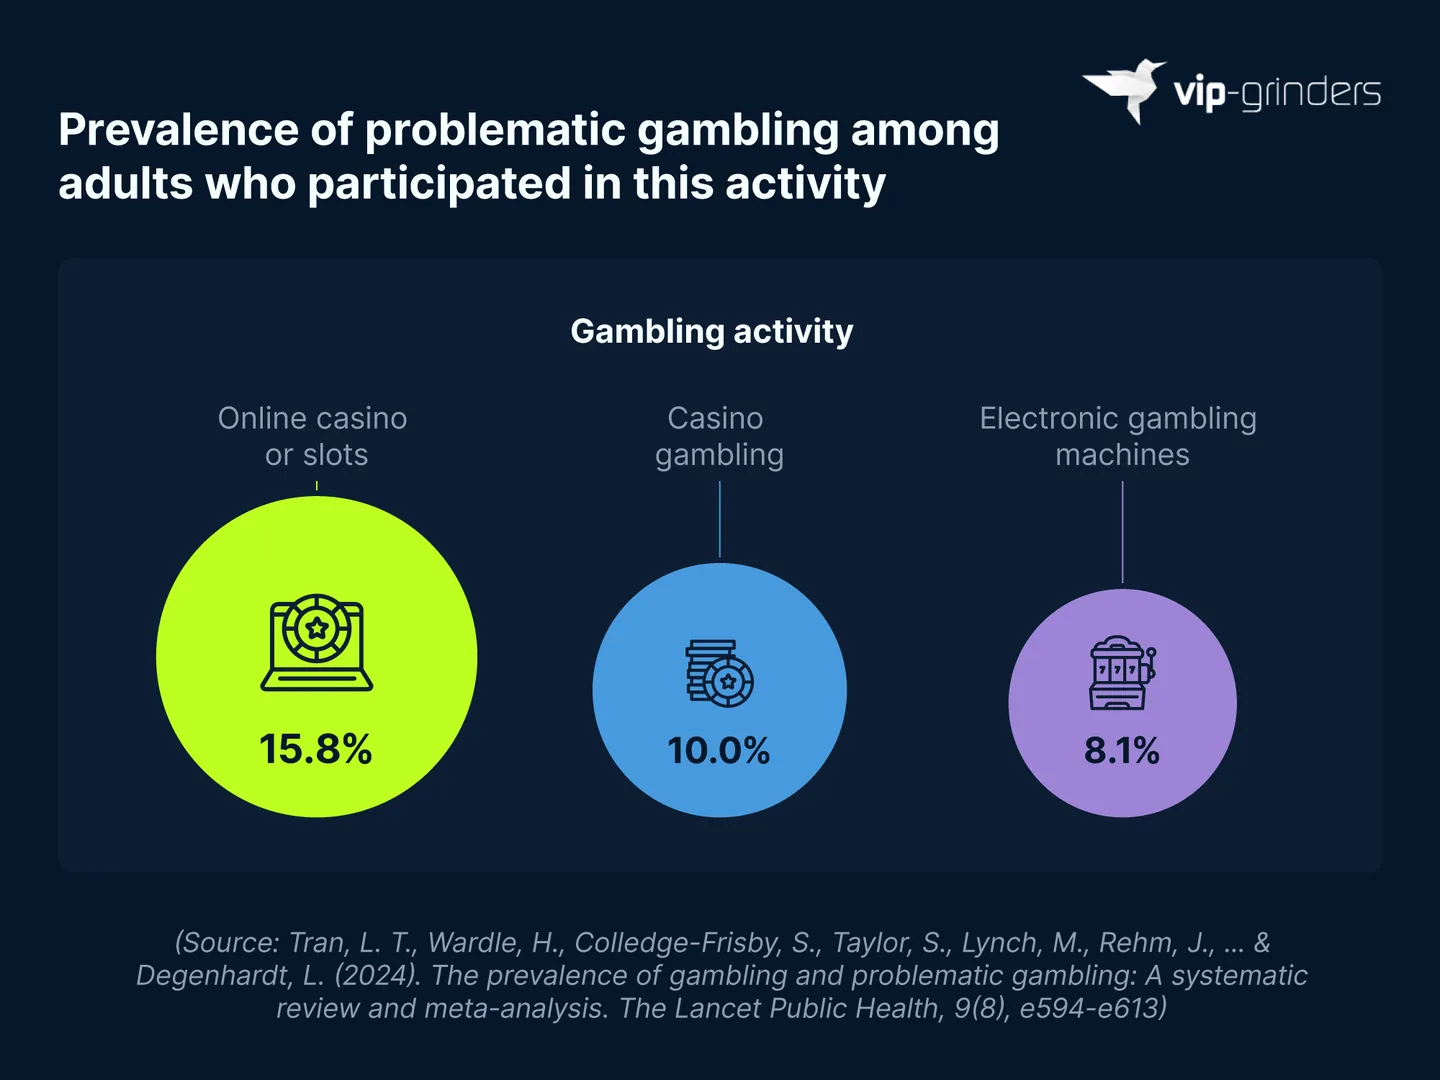
By comparison, 10% of people engaged in in-person casino gambling displayed problematic gambling behavior, with 8.1% of adults playing electronic gambling machines being at risk of problem gambling.
The meta-analysis published by The Lancet Public Health combines and uses several different measures of problematic gambling. These figures are not comparable with the PGSI scale cited by NHS England and the Gambling Commission.
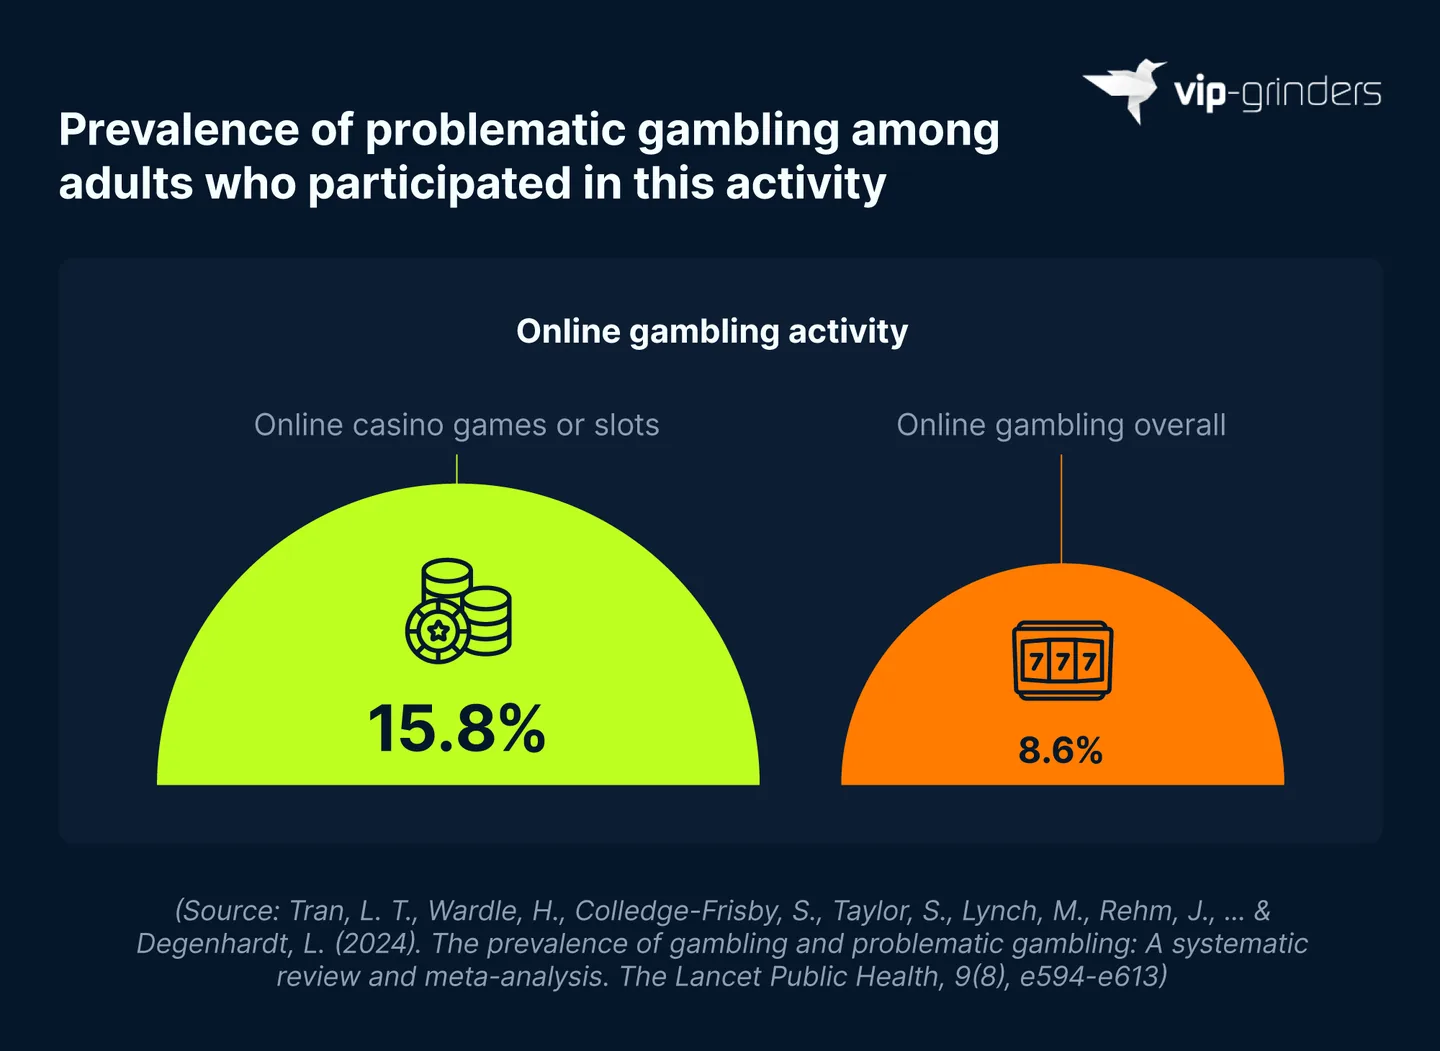
Even when looking only at online gambling, casino games and slots showed a higher prevalence of problematic gambling behavior. The 15.8% recorded among online casino games or slots players was over seven percentage points more than the 8.6% found across online gambling as a whole.
Sports Betting Addiction Statistics
Sports gambling addiction statistics from the Gambling Commission in 2025 found that people who bet on sports or racing online had over four times the odds of recording a PGSI score of eight or more.
However, this difference disappeared once researchers accounted for how frequently people gambled and how many different gambling activities they took part in. This suggests that broader gambling habits may help explain the higher odds among online sports and racing bettors, rather than participation in these activities alone.
Elsewhere, a global meta-analysis published by The Lancet Public Health in 2024 estimated that 8.9% of people who partook in sports betting had engaged in problematic gambling at some point over the previous 12 months. However, differences in research methods mean this estimate is not directly comparable with the Gambling Commission’s figures.
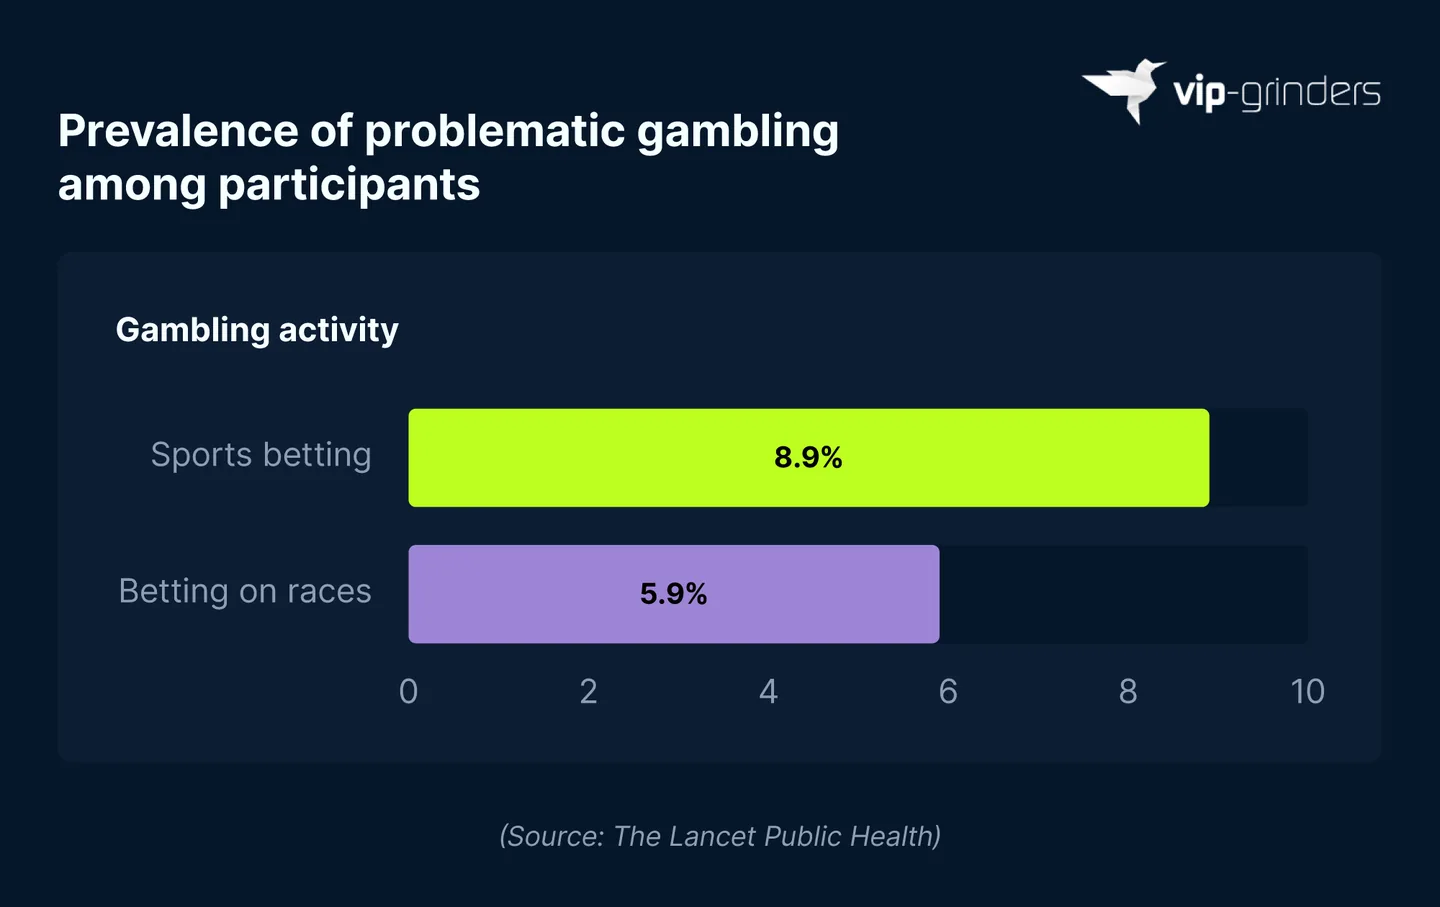
The percentage of people who’d bet on races with problematic behavior was three percentage points lower than the corresponding number for sports betting, at 5.9%. Nevertheless, both prevalence rates were several times above the study’s estimate of 1.4% for all adults globally.
Has Sports Betting Legislation Increased Gambling Disorders in the US?
A report published by Epic Research in 2026 found that diagnosed gambling disorder rates experienced an increase in US states that have legalized sports betting since 2018, the year that the US Supreme Court struck down the federal ban on sports gambling.
The quarterly rate increased from 3.0 cases per 100,000 adult patients in Q1 2018 to 4.8 per 100,000 by Q1 2026, representing a rise of around 60%.
Over the same period, states that have not legalized sports betting saw their diagnosed gambling disorder rates fall by around 29% over eight years, from 3.1 per 100,000 in Q1 2018 to 2.2 per 100,000 by Q1 2026.
Gambling disorder diagnosis rates per 100,000 adult patients in US states with and without legalized sports betting. Source: Epic Research
The difference between the two groups became particularly prominent from 2025 onward, when rates for legalized states passed 4 per 100,000 for the first time.
The latest rate of 4.8 for Q1 2026 marked an eight-year high, exceeding the previous peak of 4.3 in Q3 2025. This was also the first time in the study that the diagnosis rate per 100,000 people in legal states was more than double that of prohibited states.
Prediction Markets Gambling Addiction Statistics
US prediction markets allow users to stake money on whether certain future outcomes will occur, including sporting and political events and economic movements.
Unlike traditional sportsbooks, where customers generally bet against the bookmaker, prediction markets generally allow users to bet against each other, with the cost to back a certain outcome depending on how other users are betting.
Unlike traditional sportsbooks and betting companies, US prediction markets can operate under federal financial regulation rather than state gambling laws, although the regulatory status of some markets remains disputed.
Problem gambling protections appeared less accessible among sports event contract bettors on prediction markets than for sportsbook gamblers. The American Gaming Association (AGA), the trade body representing US casinos and sportsbooks, commissioned a white paper, Betting Without a Safety Net: Consumer Protection Gaps for Sports Bettors on Prediction Platforms, which found that just 28% of sports event contract bettors surveyed said responsible gaming tools were easy to find. By comparison, 58% of sportsbook users said the same.
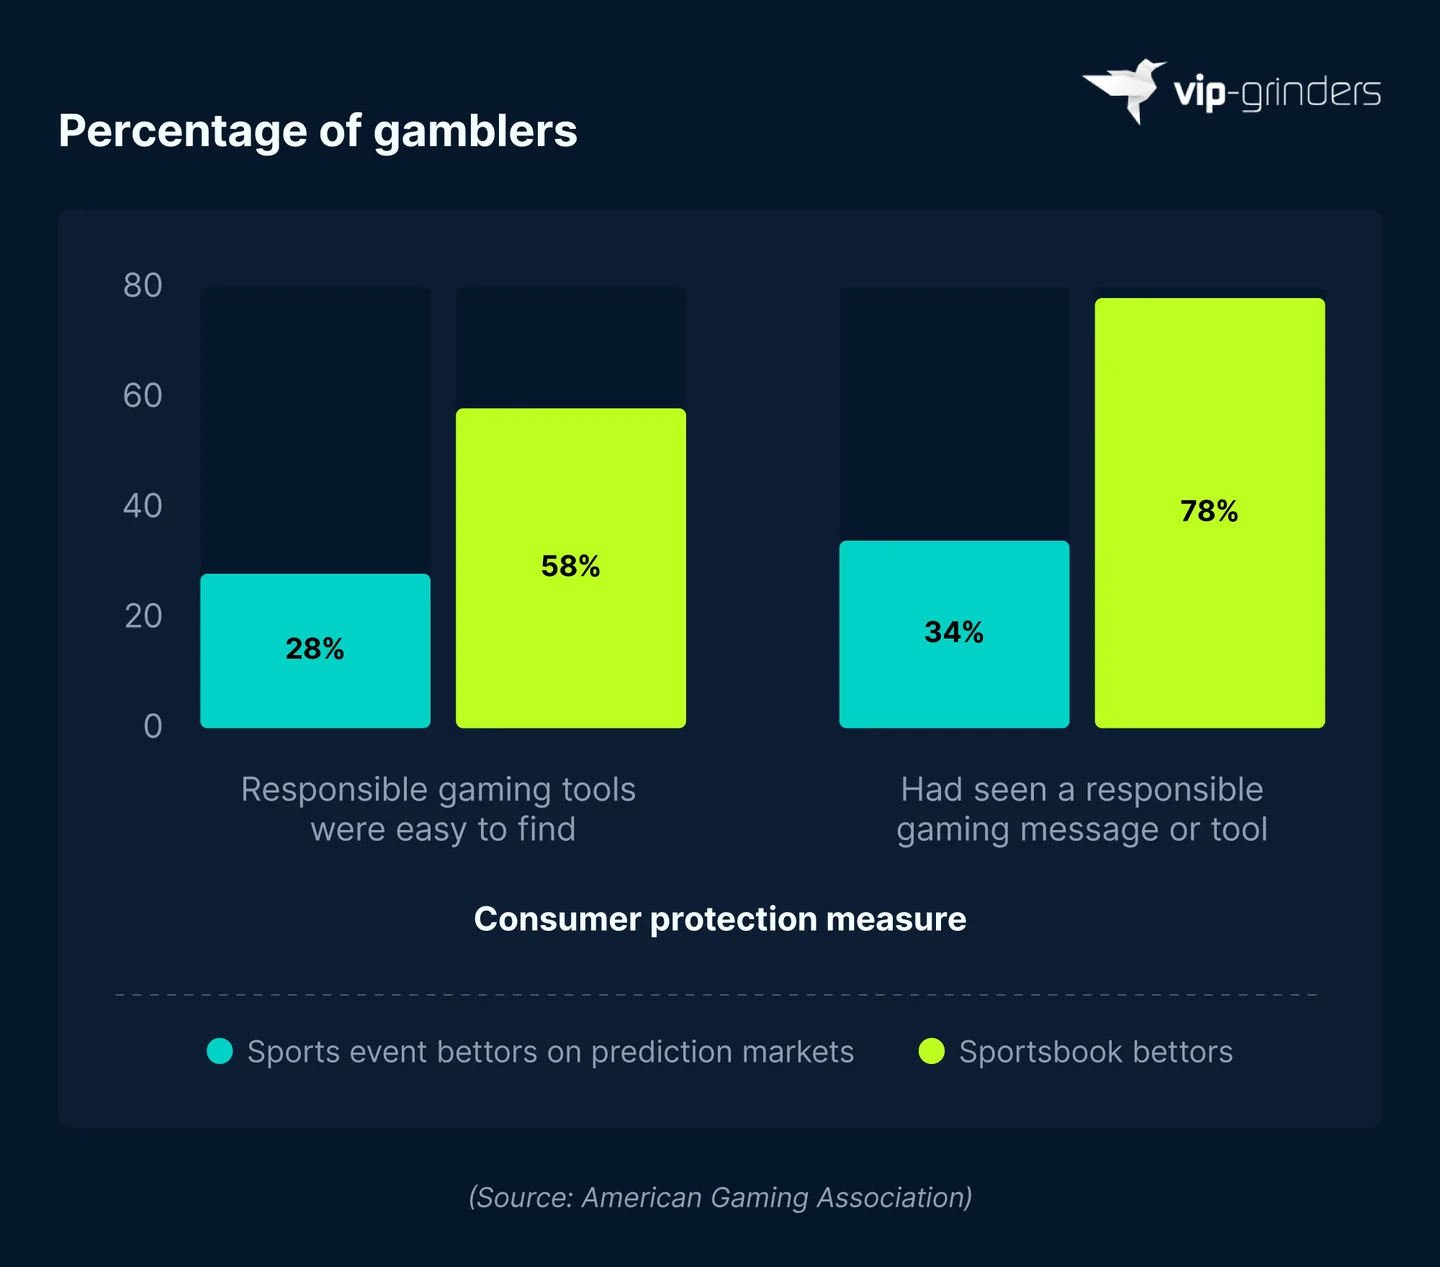
The difference was even greater regarding the visibility of responsible gambling information. Just 34% of sports event contract bettors recalled seeing a responsible gaming message or tool, less than half the 78% recorded among sportsbook users.
The same study found that 28% of sports event contract bettors considered the activity to be a form of investing, compared to 9% of sportsbook users. This highlights a key difference in how a proportion of users perceive the activities, despite both involving placing money on the outcome of sporting events.
The prevalence of sports in prediction markets is demonstrated further by data from VIP-Grinders’ Prediction Markets report, which found that sports accounted for almost half of everything traded on Kalshi and Polymarket, the world’s two largest prediction markets.
Effects of Gambling Addiction
Gambling Commission data on the harmful effects of gambling addiction estimated that 2.7% of adults who gambled in the previous year experienced one or more severe consequences from their own gambling in 2025.
A relationship breakdown was the most common severe consequence, reported by 1.7%, with 1.1% having experienced violence or abuse or lost something of financial value.
Just under 1% of the surveyed group who had gambled in the past 12 months reported committing a crime as a result of their gambling.
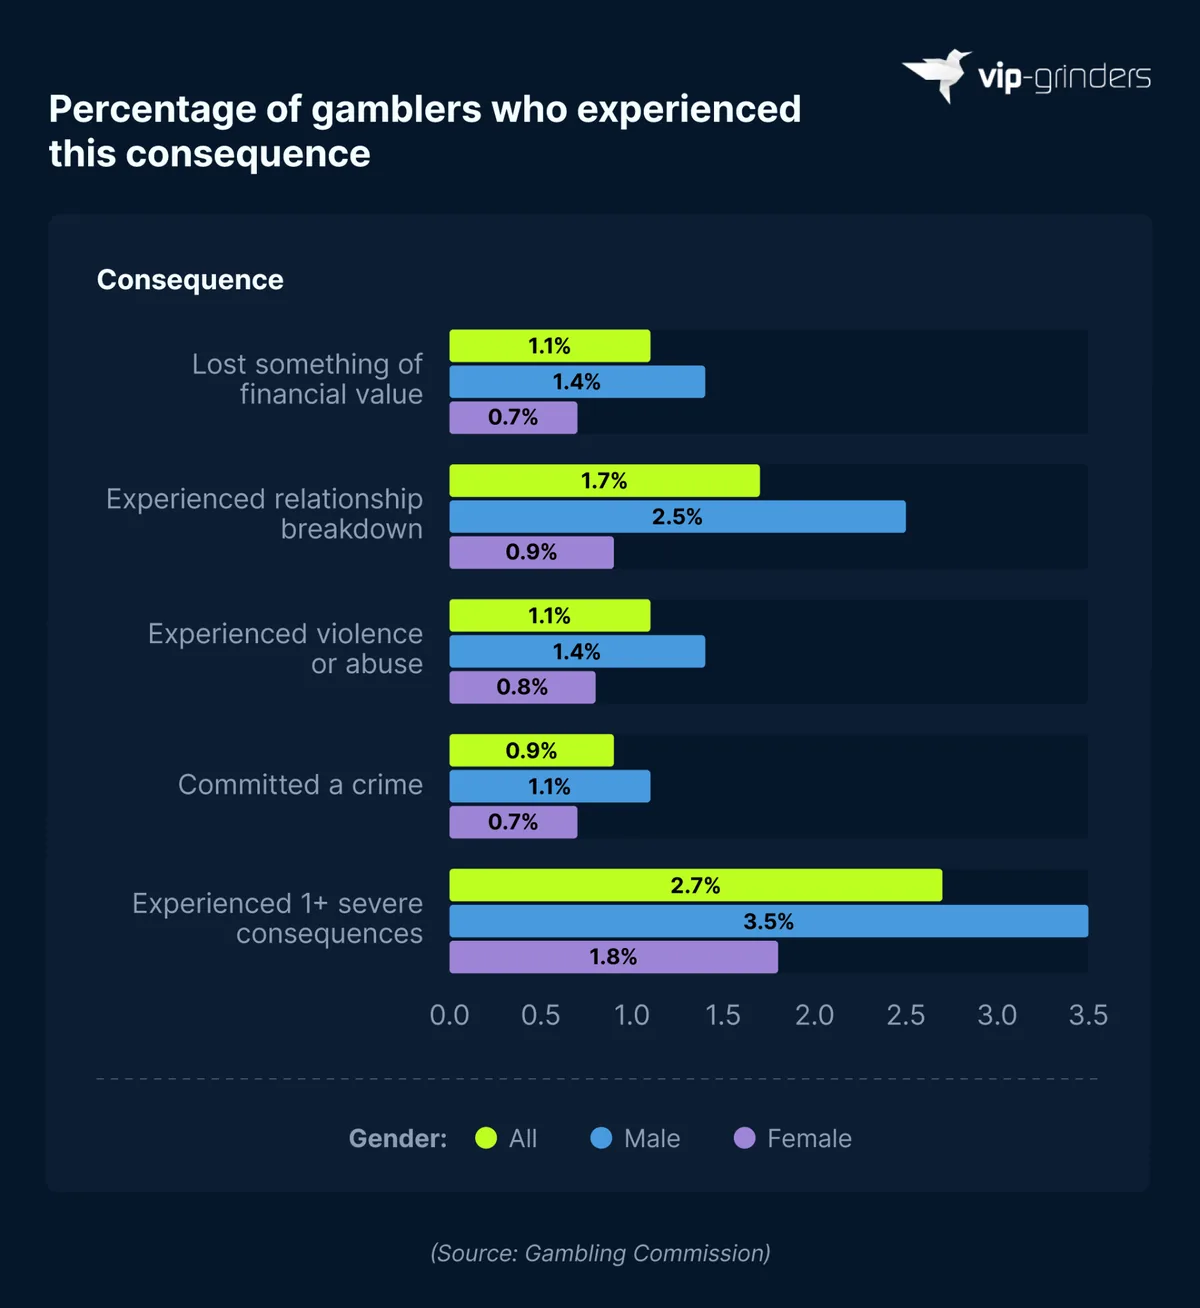
Men recorded higher rates in all of the severe consequences in the study, with 3.5% reporting one or more severe consequences, compared to 1.8% of women. Relationship breakdown was the most prevalent single consequence among both genders, at 2.5% for men and 0.9% for women.
Effects of Gambling Addiction on Mental Health
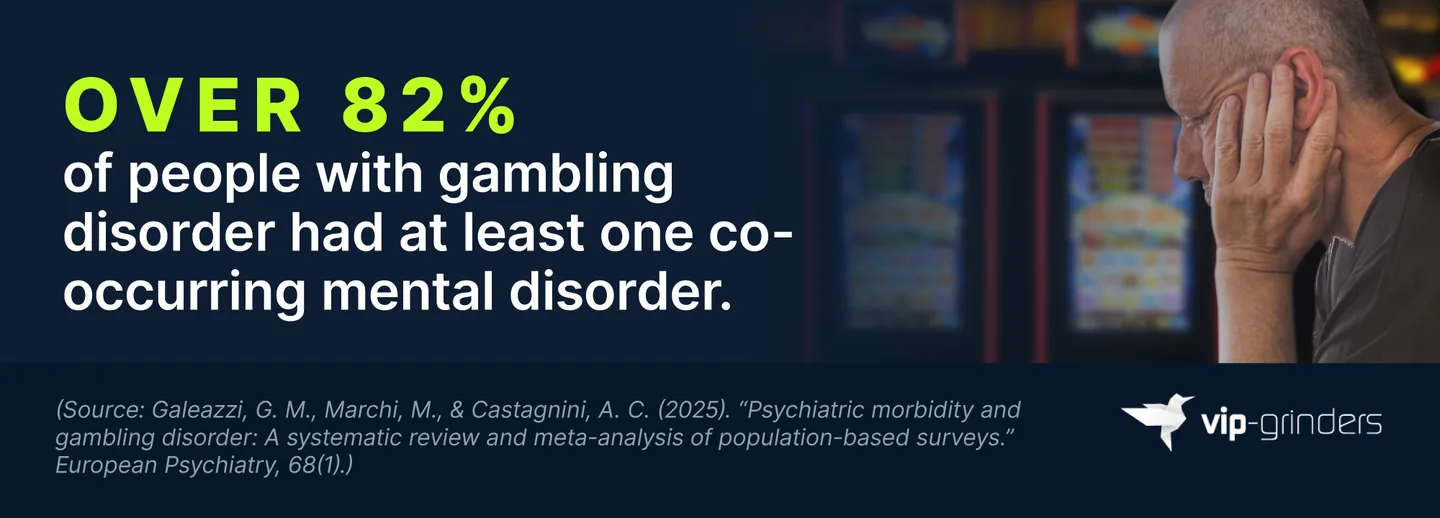
A 2025 systematic review and meta-analysis published in European Psychiatry found that 82% of people living with gambling disorder have at least one other mental disorder, with common co-occurring issues relating to mood, anxiety, and substance use.
A separate meta-analysis, Suicidal Behaviors and Associated Factors Among Individuals with Gambling Disorders: A Meta-Analysis, published in 2023, found that 31% of people with gambling disorder had experienced suicidal ideation during their lifetime, while 16% had attempted suicide.
Effects of Gambling Addiction on Relationships and Other People
Gambling-related harm can extend far beyond the person gambling. An International Gambling Studies report estimated that for every person gambling at high-risk levels, an average of six people are impacted.
In the Gambling Commission’s 2025 analysis, health problems, including stress or anxiety, were the most commonly cited adverse consequence of someone else’s gambling in Great Britain, affecting 10.8% of adults who had someone close to them who gambled.
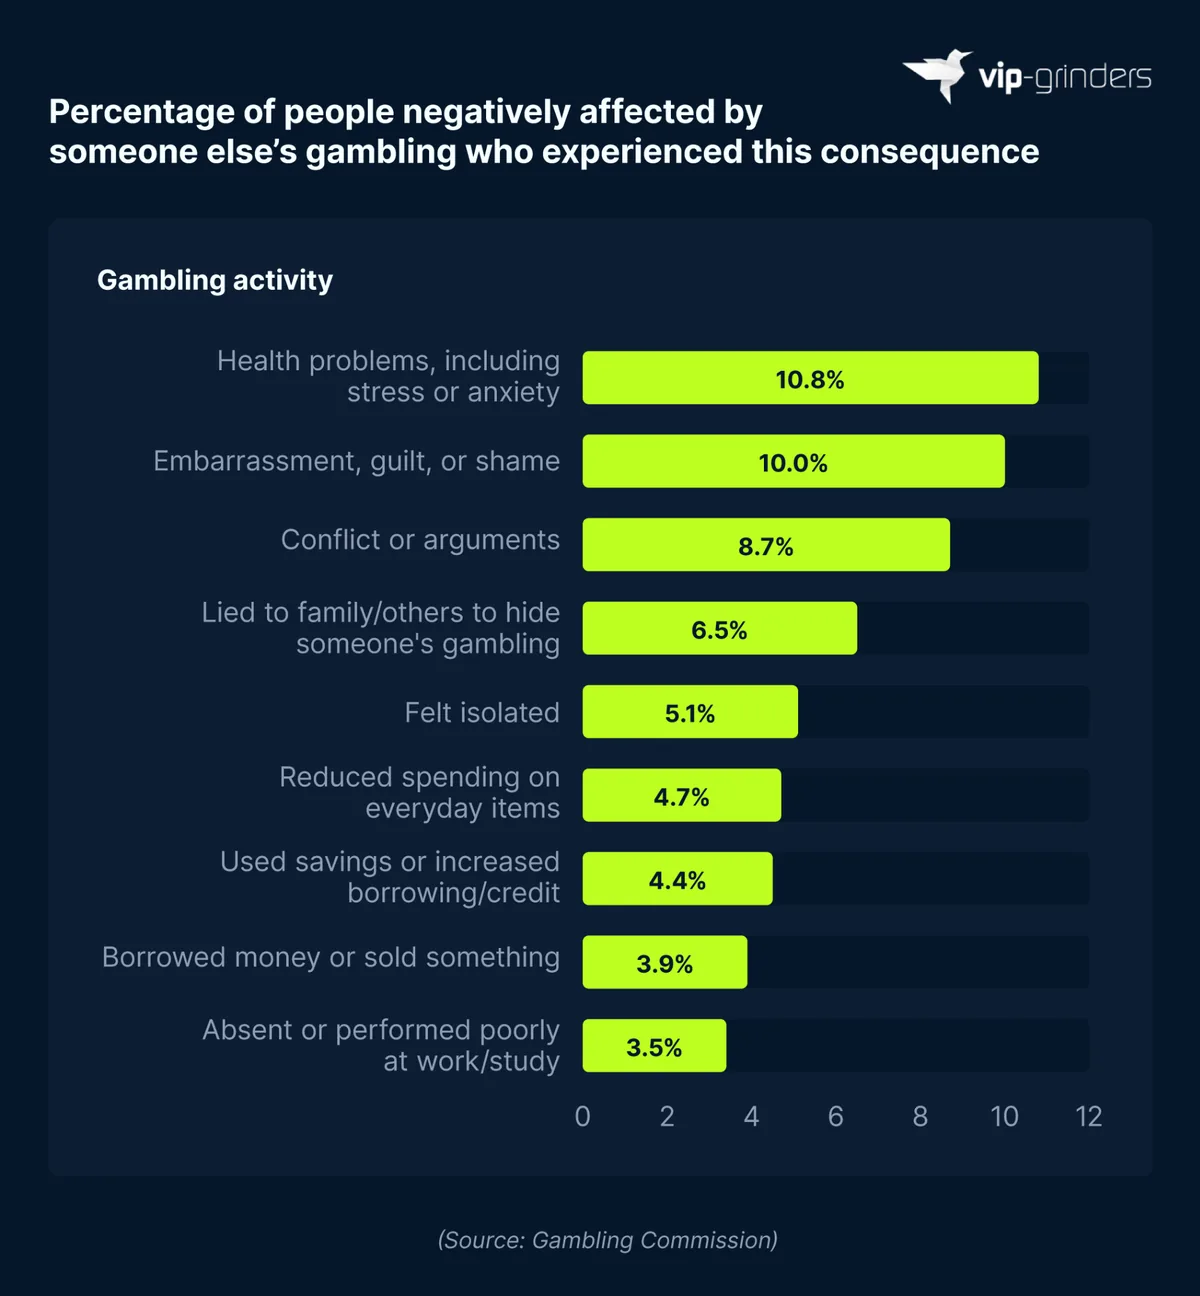
Embarrassment, guilt, or shame was the next most common consequence, experienced by 10%, with 8.7% citing conflict or arguments as a negative consequence of someone else’s gambling.
Effects of Gambling Addiction on Employment, Finances, and Education
Analysis of gambling addiction statistics revealed a link between gambling expenditure and negative financial consequences. A 2021 study published in Nature Human Behaviour, titled The Association Between Gambling and Financial, Social and Health Outcomes in Big Financial Data, found that a 10-percentage-point increase in the proportion of spending devoted to gambling was associated with a 97.5% higher likelihood of missing a mortgage payment.
The consequences also extended to employment, with an Office for Health Improvement and Disparities report estimating that nearly 23,000 unemployment benefit claims in 2019 were associated with problem gambling in England alone. This was estimated to cost the government around £77 million a year based on 2021 to 2022 prices.
Estimated cases and government costs associated with gambling-related harm in England
| Outcome | Estimated annual number of cases | Estimated annual excess cost to government |
|---|---|---|
| Unemployment benefit claims associated with problem gambling | 22,932 | £77 million |
| Statutory homelessness applications from men associated with low risk, moderate risk, and problem gambling combined | 15,856 | £49 million |
(Source: Data from the Office for Health Improvement and Disparities, The economic and social cost of harms associated with gambling in England report)
Housing was also affected, with an estimated 15,856 statutory homelessness applications from men associated with low risk, moderate risk, or problem gambling between 2019 and 2020, at an annual cost to the government of £49 million in 2021 to 2022 prices.
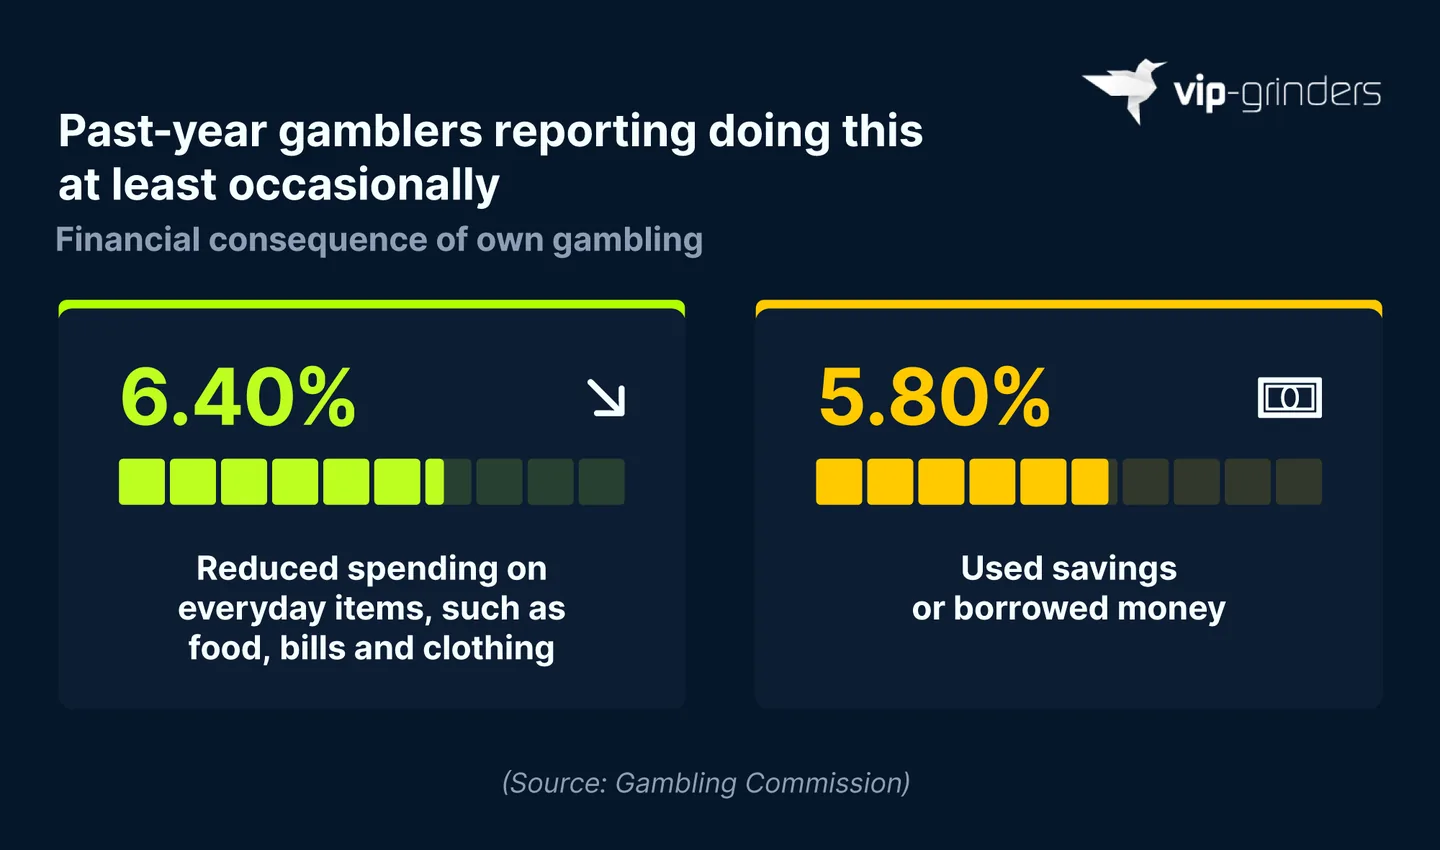
A report from the Gambling Commission found that 6.4% of past-year gamblers in Great Britain had reduced spending on everyday items, such as bills, food, and clothing, as a result of their gambling.
5.8% of adults who gambled in the past 12 months had used savings or borrowed money, highlighting the potential impact on personal finances beyond everyday spending.
Effects of Gambling Addiction on Criminal and Antisocial Behavior
Recent problem gambling statistics from the Office for Health Improvement and Disparities estimated that 3,744 people between 2018 and 2020 in England went to prison for reasons associated with problem gambling.
Estimated cases and government costs associated with crime-related gambling harm in England
| Criminal harm associated with problem gambling in England | Estimate |
|---|---|
| Excess number of people in prison associated with problem gambling | 3,744 |
| Estimated direct cost to government | £167.3 million |
(Source: Data from the Office for Health Improvement and Disparities, The economic and social cost of harms associated with gambling in England report)
These cases were estimated to cost the government over £167 million, making it the largest public sector cost associated with problem gambling.
Gambling Addiction Search Trends
VIP-Grinders research analyzed Google Trends data from 2016 to 2025 to identify search interest patterns around problem gambling in the US and UK. The analysis compared average search interest in each month with typical levels across the full study period.
The data showed that March was the peak month for problem gambling-related search terms across both countries, with interest 15% above average in the US and 13% higher in the UK.
Monthly problem gambling search interest compared with average levels, 2016 to 2025. Source: VIP-Grinders / Google Trends
The first third of the year saw the biggest spikes in both the US and UK, with numbers returning close to the average by May.
June was the first month of the year that both countries recorded below-average search interest, at -9% in the US and -10% in the UK. August was the lowest month for search interest in the US, at -14%, with the UK’s lowest month occurring in July (-11%).
Search term interest in both countries slowly increased as the end of the year approached, returning to slightly above-average interest in October and November before settling at the average level in December.
Problem Gambling Search Trends by Theme
When broken down by theme, problem gambling-related search interest in the US grew at substantially faster rates than in the UK between 2016 and 2025.
When accounting for all problem gambling-related searches in VIP-Grinders’ study, the US saw an increase of 84% over the nine-year period, while interest in the UK remained largely stable.
Money-related gambling worries saw the biggest increase in search interest in the US, climbing by 329%, compared to 65% in the UK.
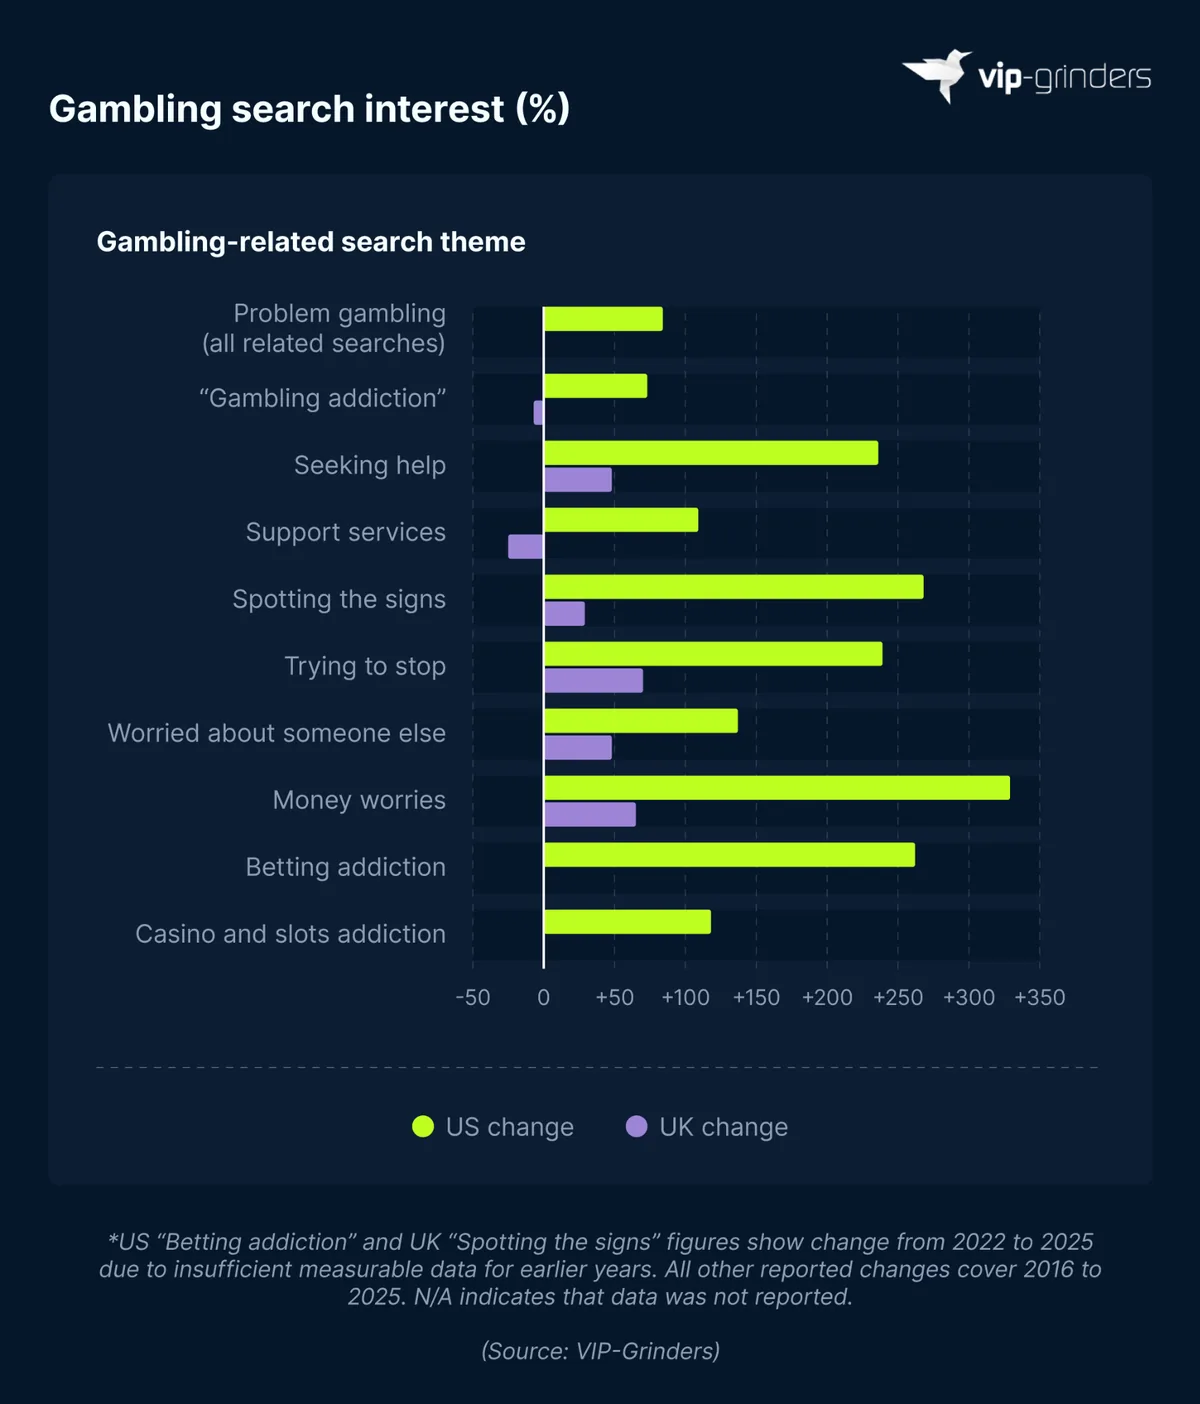
Searches around trying to stop gambling (+239%) more than tripled in the US between 2016 and 2025, while increasing by 70% in the UK.
The US saw rises across every problem gambling-related theme in the study, whereas search interest declined in two categories in the UK. Of these, searches specifically around gambling addiction fell by 7%, while support service-related search interest dropped by 25%.
Problem Gambling Search Trends by Country
VIP-Grinders analyzed 15 of the countries with the largest gambling markets in terms of gross gaming revenue (GGR) to compare changes in problem gambling-related search interest on Google Trends between 2016 and 2025.
Brazil saw by far the biggest spike in interest, with overall rises of 787% across all problem gambling-related searches in the study. This was over three times more than any other country analyzed, making Brazil the only one with interest growth exceeding 300%.
Change in problem gambling search interest across major gambling markets, 2016 to 2025. Source: VIP-Grinders / Google Trends
Mexico had the next largest increase in problem-gambling-related search interest, with interest more than tripling (+240%) between 2016 and 2025. The Philippines was the final country to see searches more than double (+150%), with South Africa (+89%) and the United States (+84%) rounding off the top five.
No European country recorded increases above 50%, with France’s increase of 46% the highest on the continent. At the other end of the scale, the UK saw its interest unchanged over the nine-year period, while interest fell across Australia (-5%), Germany (-28%), and Singapore (-38%).
Gambling Addiction Recovery Statistics
A Canadian study published in 2022, using survey data collected in 2018 to 2019, found that almost three in five (59.8%) people with a PGSI score of five or more had attempted to reduce or stop gambling over the previous year.
This number fell to just 5.7% when accounting for all past-month gamblers, suggesting that attempts to cut back or stop were far higher in those gambling at higher risk levels.
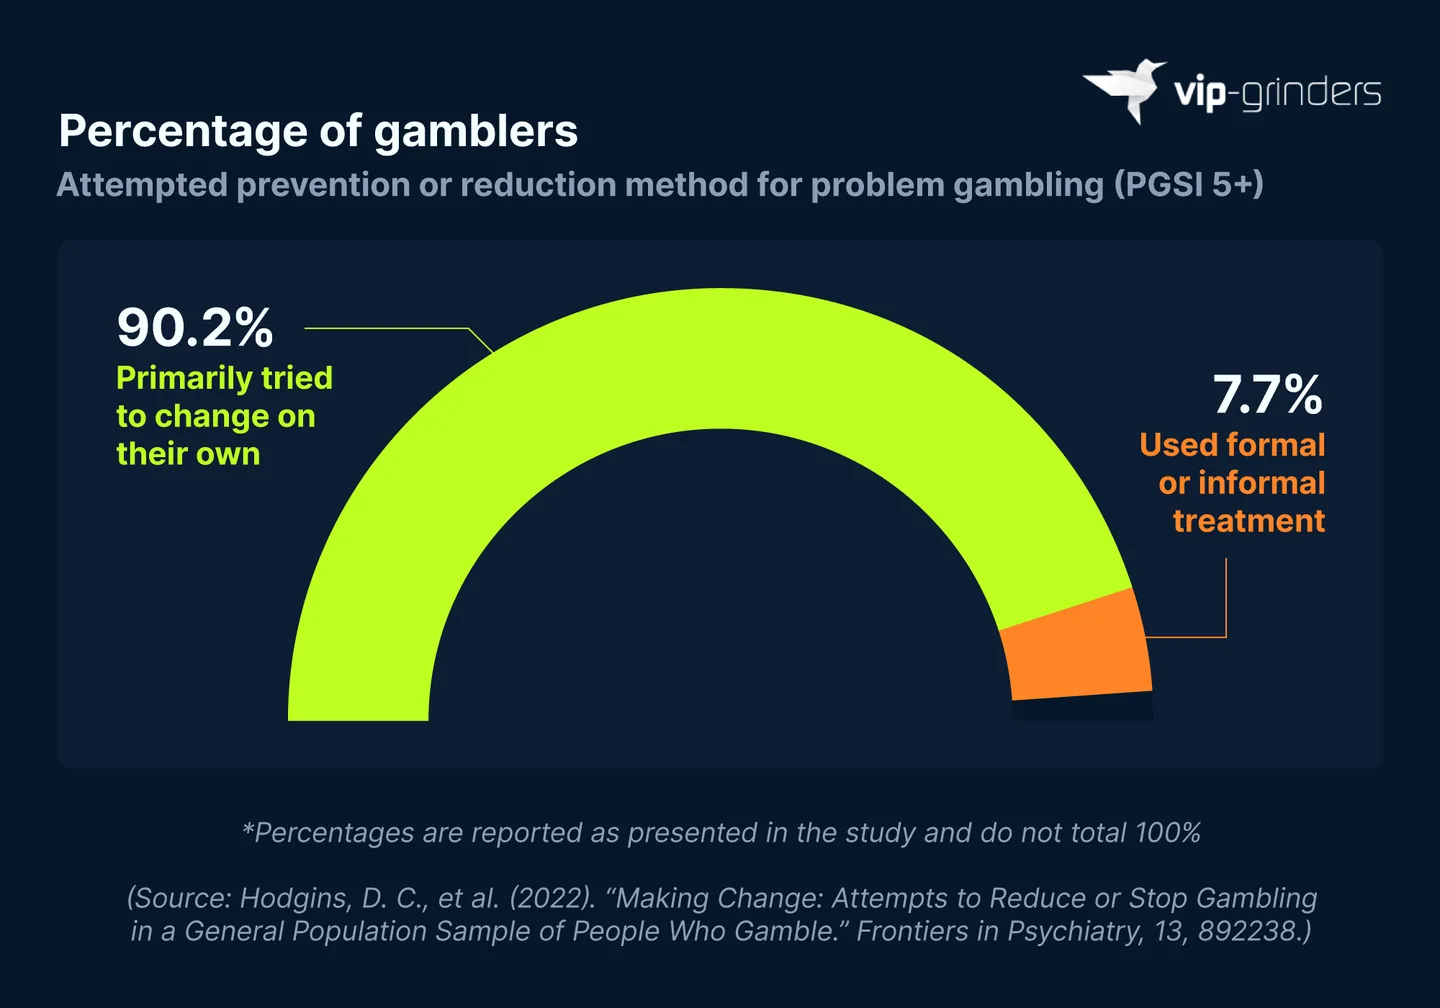
Among those with a PGSI score of five or more who attempted to stop or reduce gambling, the vast majority (90.2%) attempted to do so on their own, with just 7.7% of respondents using formal or informal treatment.
It’s worth noting that this study defines problem gambling as a PGSI score of 5 or more, rather than the threshold of 8 or more used by the Gambling Commission, meaning the figures are not directly comparable.
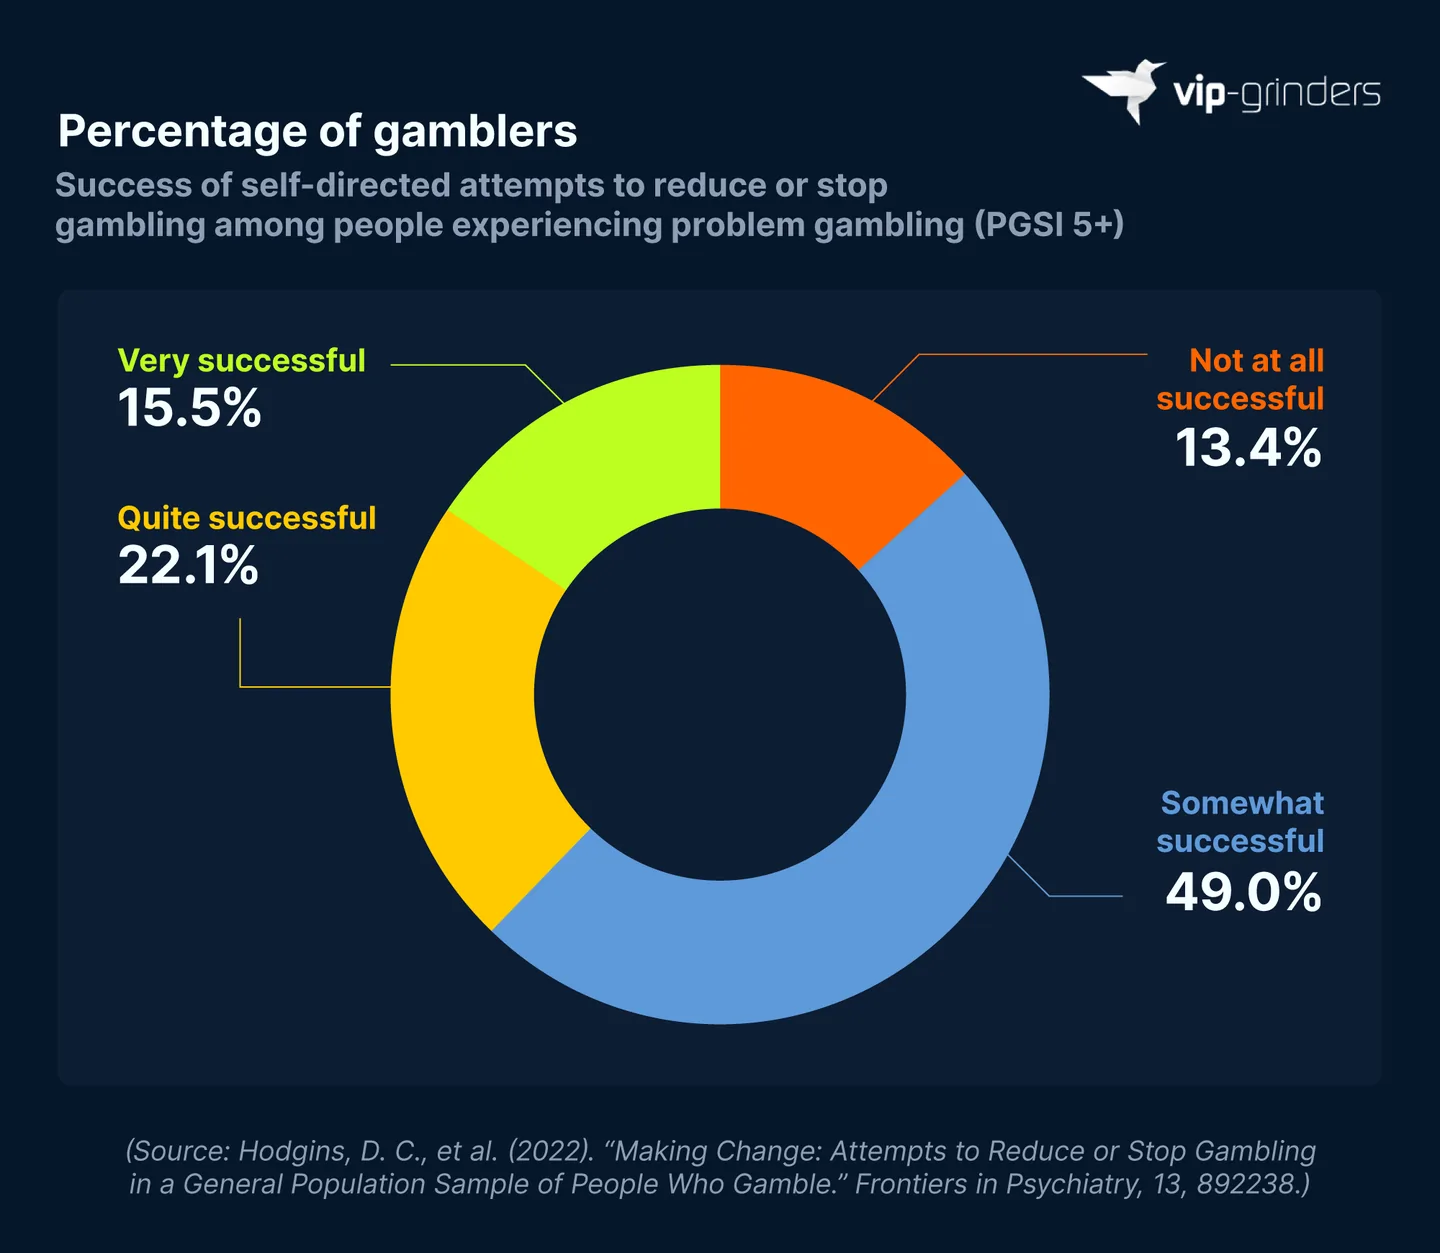
Of those who tried to change on their own without treatment, 15.5% described their attempts as very successful, with 22.1% of people considering them quite successful.
Nearly half (49%) considered this approach to be somewhat successful, with 13.4% claiming they had no success at reducing or stopping their gambling at all.
Gambling Addiction Treatment Statistics
Self-help materials were the most common support method accessed to help those experiencing problem gambling (PGSI score of five or above) reduce or stop, with 22% citing this method. This was over six percentage points more than any other treatment type, with self-exclusion programs the next most common, at 15.7%.
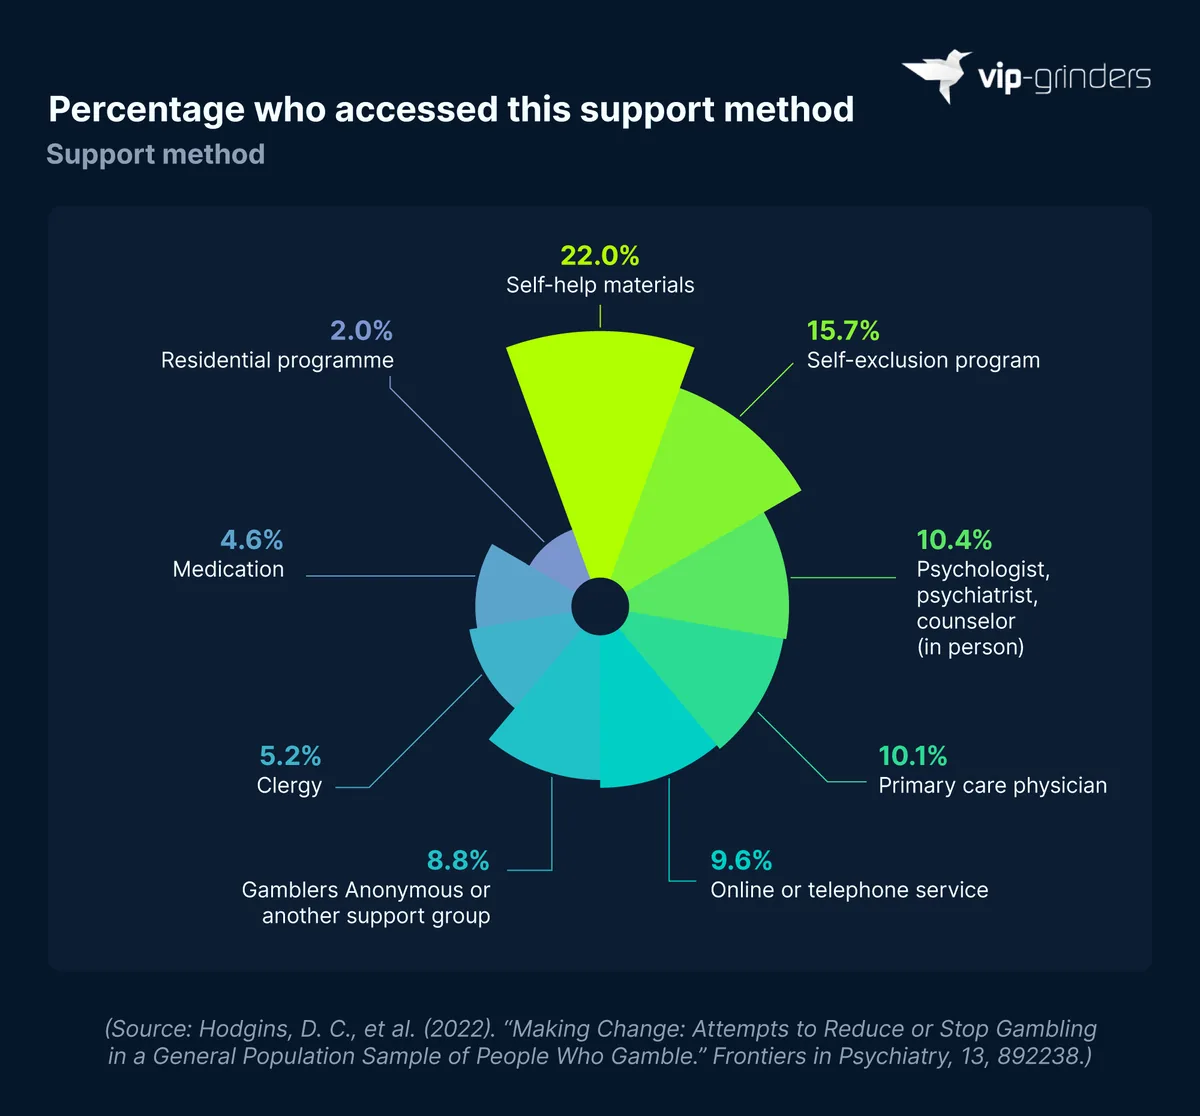
There was also a notable use of in-person medical support. Over a tenth (10.4%) of the sample sought treatment from a psychologist, psychiatrist, or counselor, with a similar proportion seeking help from a primary care physician.
How Beneficial Is Gambling Addiction Treatment?
Research from the Office for Health Improvement and Disparities estimated that 445,000 adults in England could benefit from gambling treatment. When broken down by treatment type, psychologist-led cognitive behavioral therapy (CBT) accounted for the biggest share, with an estimated 243,000 adults standing to benefit from this treatment.
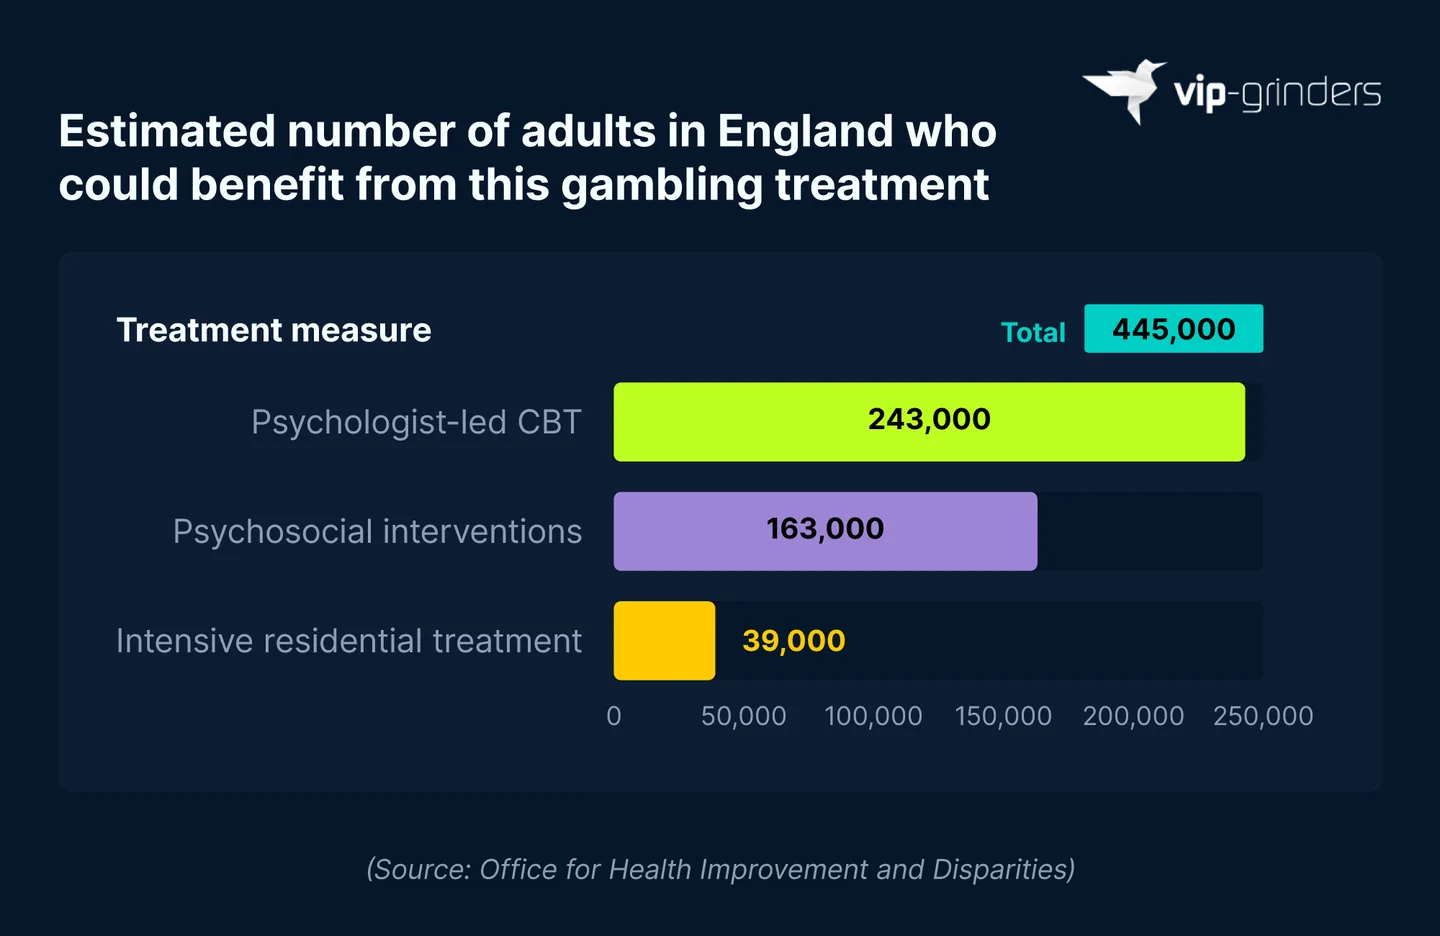
The report estimated that a further 163,000 could benefit from psychosocial interventions, while 39,000 could benefit from intensive residential treatment.
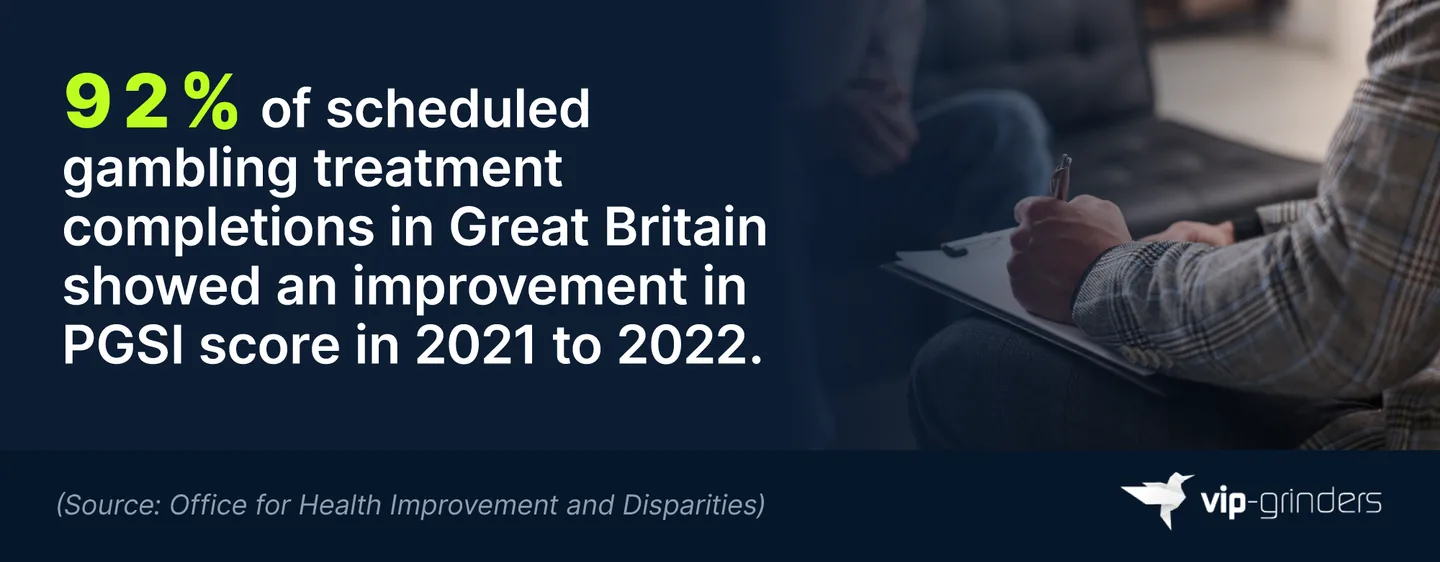
The effectiveness of treatment was outlined in the report, which found that 92% of treatment episodes that completed scheduled treatment for problem gambling showed an improvement in PGSI score between 2021 and 2022. By comparison, the improvement rate was 62% in cases where treatment was ended earlier than planned.
Which US States Are Investing the Most to Combat Problem Gambling?
VIP-Grinders analyzed problem-gambling budgets across US states for 2025 to 2026 to identify which parts of the US had the largest problem gambling funding per resident.
With an annual problem gambling fund of $53.1 million, Massachusetts has by far the highest funding per resident at $7.42. This is over triple the total of any other state for both overall funding and funding per resident.
Estimated problem gambling funding and funding per resident by US state, 2025 to 2026. Source: VIP-Grinders / NAADGS
Oregon had the next highest funding, with its total of $9 million resulting in a funding per resident of $2.10. This made Oregon the only other state with funding per resident exceeding $2.
Estimated problem gambling funding per resident by US state, 2025 to 2026
| Rank | US jurisdiction | Estimated problem gambling funding | Funding per resident |
|---|---|---|---|
| 1 | Massachusetts | $53.1m | $7.42 |
| 2 | Oregon | $9.0m | $2.10 |
| 3 | Delaware | $1.9m | $1.79 |
| 4 | Nebraska | $3.2m | $1.59 |
| 5 | Louisiana | $7.0m | $1.52 |
| 6 | Minnesota | $8.7m | $1.49 |
| 7 | Illinois | $15.0m | $1.18 |
| 8 | Connecticut | $4.2m | $1.15 |
| 9 | Wyoming | $616k | $1.05 |
| 10 | Ohio | $12.2m | $1.03 |
| 11 | Maryland | $6.1m | $0.97 |
| 12 | West Virginia | $1.5m | $0.85 |
| 13 | New Jersey | $8.0m | $0.83 |
| 14 | North Dakota | $660k | $0.83 |
| 15 | Vermont | $500k | $0.78 |
| 16 | Pennsylvania | $9.9m | $0.76 |
| 17 | Iowa | $2.1m | $0.66 |
| 18 | Nevada | $2.1m | $0.64 |
| 19 | Colorado | $3.8m | $0.63 |
| 20 | Tennessee | $4.4m | $0.60 |
| 21 | Maine | $793k | $0.56 |
| 22 | Kansas | $1.6m | $0.54 |
| 23 | Michigan | $5.4m | $0.53 |
| 24 | New York | $10.6m | $0.53 |
| 25 | Virginia | $4.3m | $0.48 |
| 26 | Indiana | $3.1m | $0.44 |
| 27 | Arizona | $3.3m | $0.44 |
| 28 | Missouri | $2.0m | $0.32 |
| 29 | South Dakota | $261k | $0.28 |
| 30 | North Carolina | $3.0m | $0.27 |
| 31 | Kentucky | $1.2m | $0.25 |
| 32 | Oklahoma | $1.0m | $0.24 |
| 33 | California | $8.5m | $0.22 |
| 34 | Washington | $1.6m | $0.20 |
| 35 | Florida | $2.0m | $0.09 |
| 36 | Wisconsin | $396k | $0.07 |
| 37 | New Hampshire | $93k | $0.07 |
| 38 | Georgia | $400k | $0.04 |
| 39 | New Mexico | $70k | $0.03 |
| 40 | Mississippi | $75k | $0.03 |
| 41 | South Carolina | $100k | $0.02 |
| 42 | District of Columbia | $0 | $0.00 |
| 43 | Montana | $0 | $0.00 |
(Source: VIP-Grinders analysis of the NAADGS 2025 Budget Update and US Census Bureau population estimates)
Note: Arkansas and Rhode Island did not report a 2025 to 2026 problem gambling budget and could therefore not be ranked. Alabama, Alaska, Hawaii, Idaho, Texas, and Utah were excluded, as they had no problem gambling funding or gambling tax covered by the study.
Despite New York recording significantly larger annual problem gambling funding than Oregon, at $10.6 million, its comparatively larger population meant this only equated to $0.53 per resident, the 24th highest overall.
Of the 43 jurisdictions ranked, the District of Columbia and Montana had the lowest totals, with neither allocating any funding toward problem gambling.
VIP-Grinders also compared problem gambling funding with state gambling tax revenue to examine the relationship between what states receive in gambling taxes and what they spend tackling related harm.
Problem gambling funding as a percentage of gambling tax revenue by US state, 2025. Source: VIP-Grinders / NAADGS / AGA
Of the states that recorded more than $25 million in gambling tax revenue in 2025, Oregon had the highest ratio, with its $9 million budget equivalent to 18.85% of annual gambling tax revenue. It’s worth noting that Oregon funds its services through the state lottery, which is not included in standard tax revenue figures.
Massachusetts was the only other state where problem gambling funding was equivalent to more than 10% of gambling tax revenue, with its nation-leading budget of $53.1 million equivalent to 10.42%.
By contrast, Mississippi recorded the lowest percentage, with its annual problem gambling fund of $75,000 equivalent to just 0.03% of gambling tax revenue.
FAQs
What Is Gambling Addiction?
Gambling addiction is a condition in which persistent, recurring, or compulsive gambling behavior occurs to the extent that it becomes difficult to control and causes significant problems in someone’s life.
What Is Gambling Addiction Treatment?
Gambling addiction treatment is a set of measures aimed at helping people control problematic gambling behavior and either stop or reduce their gambling. Treatment can include cognitive behavioral therapy (CBT), peer support groups such as Gamblers Anonymous, other medical or social interventions, and in some cases, intensive residential treatment.
What Is Considered Problem Gambling?
Problem gambling generally refers to gambling behavior that causes significant negative consequences. Under the Problem Gambling Severity Index (PGSI), a score of eight or above meets the criteria for problem gambling.
How Is Problem Gambling Measured?
The Problem Gambling Severity Index (PGSI) measures problem gambling via a nine-question screening tool that asks about gambling behavior and consequences. Respondents are then given a score between 0 and 27 based on their answers, with higher scores indicating greater levels of gambling problems.
Is Problem Gambling More Common Among Men or Women?
Problem gambling is generally more prevalent among men than women. In Great Britain, a 2025 Gambling Commission study found that 5.3% of men who’d gambled in the previous 12 months had a PGSI score of eight or more, compared to 2.7% of women.
What Percentage of People with Gambling Problems Seek Treatment?
Studies have found treatment uptake for problem gambling to be relatively low when compared with the scale of the problem. A 2022 Canadian study found that just 7.7% of people displaying gambling problems (PGSI of five or above) who were attempting to reduce or stop gambling accessed formal or informal treatment.
How Can You Spot Gambling Addiction?
Gambling addiction can be difficult to recognize, as the warning signs aren’t always obvious. Common signs include spending more time or money on gambling than intended, chasing losses, borrowing money to gamble, and hiding gambling habits from friends or family.
Someone struggling with gambling addiction may also become anxious, irritable, or withdrawn when they’re unable to gamble. They might neglect work, relationships, or everyday responsibilities, experience financial difficulties, or repeatedly try to stop gambling without success.
If gambling is becoming too difficult to control or negatively impacting someone’s finances, relationships, or mental health, it may be a sign of addiction. Recognizing these warning signs early and seeking professional support can help prevent further harm.
Is Gambling Addiction a Mental Illness?
Yes, gambling addiction is recognized as a mental health disorder. Also known as gambling disorder, it involves difficulty controlling gambling habits despite harmful consequences.
The American Psychiatric Association’s DSM-5 lists gambling disorder alongside substance use disorders, and the World Health Organization’s ICD-11 classifies it as a disorder due to addictive behaviors. It can affect mental health, finances, and relationships, but professional treatment and support can help.
Sources and Methodology
This page draws on data from health bodies, gambling regulators, academic research, industry organizations, and VIP-Grinders’ own independent research. The sections below explain the methodology behind our original research and list every source referenced throughout this page.
Problem Gambling Search Trends Analysis
To assess how interest in problem gambling has changed over time, VIP-Grinders analyzed monthly Google Trends data from January 2016 to December 2025.
For the US and UK, the analysis used Google’s “problem gambling” topic alongside the search term “gambling addiction.” The “problem gambling” topic captures searches Google identifies as relating to the subject regardless of the exact wording or language used, while “gambling addiction” only captures searches containing those specific words.
A further range of problem gambling searches were grouped into eight themes to account for the different ways people search for related information: seeking help, support services, spotting the signs, trying to stop, worries about someone else, money worries, betting addiction, and casino and slots addiction. Where individual search terms had insufficient data, related terms were combined to create a measurable theme.
Each US and UK search was placed on a common scale for its country, using “gambling addiction” as the benchmark and setting its average monthly search interest in 2016 to 100. One-off search spikes were adjusted where interest rose to at least 1.5 times the median of the surrounding six months before returning to normal levels. Years with three or more months of insufficient Google Trends data were not reported.
Changes in search interest compared the average for 2025 with the average for 2016. US searches for betting addiction and UK searches for spotting the signs instead use 2022 as their starting point, as earlier years contained insufficient measurable data. Betting addiction and casino and slots addiction were excluded from the UK analysis entirely due to insufficient measurable data.
Average annual growth was calculated using the compound annual growth rate (CAGR). Monthly patterns were calculated by comparing each month with the average of the surrounding 12 months across 2016 to 2025, excluding the 2020 lockdown period.
Country Search Trends Analysis
To compare international search trends, VIP-Grinders selected 15 of the world’s largest gambling markets based on the latest available gross gaming revenue (GGR) figures from regulators, governments, and industry sources. GGR figures were converted into US dollars where required.
Mainland China was excluded because Google is blocked, South Korea because Naver is the country’s dominant search engine, and Hong Kong and Macao because search volumes were too low to provide sufficient data. The final analysis covered the United States, Japan, Italy, the United Kingdom, Australia, Germany, France, Canada, Spain, Brazil, the Philippines, Singapore, the Netherlands, South Africa, and Mexico.
The analysis used Google’s “problem gambling” topic. The “problem gambling” topic captures searches Google identifies as relating to the subject regardless of the exact wording or language used. Changes in search interest compared the average for 2025 with the average for 2016.
US Problem Gambling Funding Analysis
To compare state investment in tackling problem gambling, VIP-Grinders analyzed each US state’s 2025 to 2026 problem gambling budget alongside its population and the gambling tax revenue collected in 2025.
Problem gambling budgets were taken from the National Association of Administrators for Disordered Gambling Services (NAADGS) 2025 Budget Update, while gambling tax revenue came from the American Gaming Association’s State of the States 2026 report. State population estimates were taken from the US Census Bureau’s Vintage 2025 data.
Most state problem gambling budgets were published by NAADGS in an unlabeled chart rather than as exact figures. VIP-Grinders therefore measured the values from the chart, calibrated them against the four budgets stated exactly in the report, and rounded the results to the nearest $1,000. For Vermont, South Dakota, and Wisconsin, figures supported by the report’s accompanying tables were used where these conflicted with the chart.
Funding per resident was calculated by dividing each state’s 2025 to 2026 problem gambling budget by its estimated population. Alabama, Alaska, Hawaii, Idaho, Texas, and Utah were excluded because they recorded neither problem gambling funding nor gambling tax revenue in the data used, while Arkansas and Rhode Island did not report a 2025 to 2026 problem gambling budget and were therefore not ranked.
VIP-Grinders also compared problem gambling funding with gambling tax revenue. For this analysis, gambling tax refers to tax paid in 2025 by commercial casinos, sports betting, and online gambling operators, excluding state lotteries, tribal casinos, and charitable gambling.
Only states with more than $25 million in gambling tax revenue and a reported 2025 to 2026 problem gambling budget were included in this ranking. States below this threshold were excluded because problem gambling services are often funded through other sources, making comparisons with gambling tax revenue less meaningful.
The high rankings of Oregon and Arizona should also be viewed alongside additional context, as both fund problem gambling services primarily through gambling-related sources not included in the tax revenue figures. Oregon does so through its state lottery and Arizona through tribal casino payments.
Source List
- World Health Organization: Gambling Fact Sheet
- The Lancet Public Health: Time for a Public Health Response to Gambling
- Journal of Behavioral Addictions: The Influence of Age on Gambling Problems Worldwide
- NCPG: Problem Gambling Awareness Month 2025
- NCPG: National Survey on Gambling Attitudes and Gambling Experiences 3.0 (2024)
- NCPG: Survey Shows Drop in Problem Gambling Risk
- Gambling Commission: Gambling Survey for Great Britain Annual Report 2025
- NHS England: Health Survey for England 2024, Adults' Health-Related Behaviours
- Gambling Commission: Adverse Consequences from Gambling: Further Insights from the GSGB 2025
- The Lancet Public Health: The Prevalence of Gambling and Problematic Gambling
- Gambling Commission: Exploring the Relationship Between Gambling Activities and PGSI Scores
- Epic Research: Gambling Disorder Diagnoses Have Risen More Than 60% in States That Legalized Sports Betting
- American Gaming Association: Betting Without a Safety Net, Consumer Protection Gaps for Sports Bettors on Prediction Platforms
- American Gaming Association: Sports Event Contracts, Selling Sports Betting as Investing
- Investopedia: Prediction Market: What It Is, How It Works and Examples
- Office for Health Improvement and Disparities: Gambling-Related Harms Evidence Review
- European Psychiatry: Psychiatric Morbidity and Gambling Disorder
- International Gambling Studies: A Typical Problem Gambler Affects Six Others
- Journal of Gambling Studies: Suicidal Behaviors and Associated Factors Among Individuals with Gambling Disorders
- Harvard Magazine: Is Gambling Becoming a Public Health Crisis?
- Office for Health Improvement and Disparities: The Economic and Social Cost of Gambling-Related Harms in England
- Gambling Commission: Gambling Survey for Great Britain Annual Report 2024
- Frontiers in Psychiatry: Making Change: Attempts to Reduce or Stop Gambling
- Office for Health Improvement and Disparities: Gambling Treatment: Assessing the Current System in England
- Nature Human Behaviour: The Association Between Gambling and Financial, Social and Health Outcomes in Big Financial Data
- Gambling Commission: Problem Gambling Screens
- Gambling Commission: GSGB 2025: Consequences from Gambling
Update Schedule
This page is part of the VIP-Grinders research programme and is updated annually. Key refresh triggers:
- Annually: Gambling Survey for Great Britain figures refreshed when the Gambling Commission publishes its next annual report.
- Annually: Google Trends search analysis updated once a full additional year of data is available.
- Annually: US state funding analysis updated with the next NAADGS budget update and AGA State of the States report.
- When published: New Health Survey for England gambling data and new NCPG national survey results.
- Ongoing: New research on gambling disorder prevalence, treatment, and recovery.
If you are a journalist, researcher, or analyst using data from this page, contact João Mourato at VIP-Grinders for verification, additional context, or access to the underlying data references.