

Online Poker Traffic Report October 2026: Global Rankings and Trends
Cash game traffic grew more into October than in any of the previous four years, and GGPoker carried most of the gain. Tournament entries held level for the first time in five Octobers, while PokerStars lost a fifth of its daily entries across a window that contained most of WCOOP. WPN enters the cash rankings at eleventh on three days of newly published data.
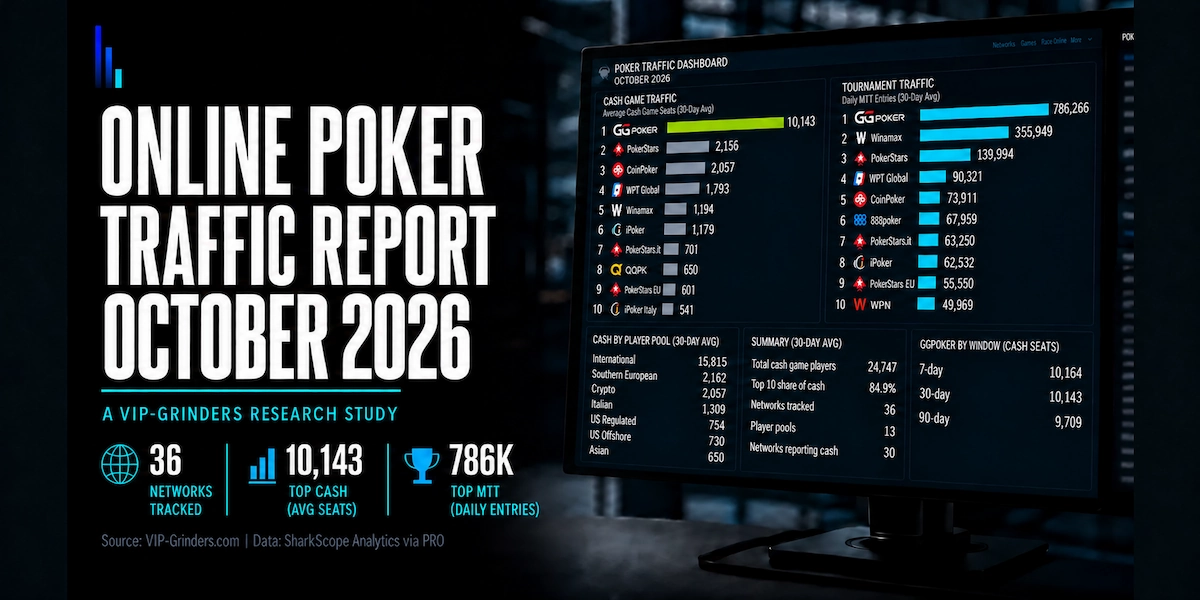
This report tracks online poker traffic across 36 networks spanning 13 reporting player pools using data sourced from SharkScope Analytics, accessed via Poker Industry PRO. Those 36 networks sit inside a wider PRO database of 86 networks across 20 player pools, seven of which report no traffic data. Rankings cover cash game players and tournament entries separately, each published at three timeframes, with the full dataset refreshed every month.
Across the 13 reporting pools, SharkScope now counts 24,747 concurrent cash game seats and 2,065,724 daily tournament entries. PRO’s pool totals and its 36 ranked networks now agree exactly on cash and differ by three entries on tournaments. Strip out WPN’s newly published cash figures and the ranked networks hold 24,284 seats against 23,315 in September, a rise of 4.2%.
Seats are not people, and this report measures seats. For player numbers, market size and tournament earnings, see our Poker Statistics 2026 research.
- Cash game players: average concurrent real-money seats filled over a 24-hour period (PST).
- MTT entries: total daily entries into real-money scheduled tournaments, excluding sit-and-gos and lottery formats.
- Markets covered: 13 reporting player pools including International, Southern European, Italian, Crypto, US Offshore, Asian, US Regulated, Ontarian, Sweepstakes, Austrian & Finnish, Canadian, Ukrainian, and South African.
- Update cadence: data exported in the middle of each month using trailing 30-day averages.
The sections below cover the October 2026 key findings, what changed in this edition, the global market overview, separate cash game and tournament rankings, a seasonal comparison against the four previous years, a three timeframe comparison, traffic breakdowns by market and by parent operator, and full methodology.
Key Findings
All figures below are sourced from SharkScope Analytics via Poker Industry PRO unless otherwise noted. Rankings use the 30-day trailing average as displayed by PRO on 14 October 2026, covering data through 12 October. Month over month comparisons are calculated by VIP-Grinders by summing PRO’s published figures from this edition and the last, so any of them can be checked against the two ranking tables.
The seasonal figures come from PRO’s daily series and its published figures for 12 October, which have no monthly archive, and are identified as such wherever they appear.
- Cash traffic posted its biggest October gain in five years: across the 16 networks with cash data on every comparison date since 2022, cash players rose 5.0%, from 16,033 to 16,838. The same window rose between 0.1% and 0.8% in each of the four prior years.
- Tournament entries did not fall, for the first time in five Octobers: the 24 network panel held level, where the four prior years fell between 5.1% and 9.9%. GGPoker added 130,485 daily entries, more than Winamax and PokerStars lost between them.
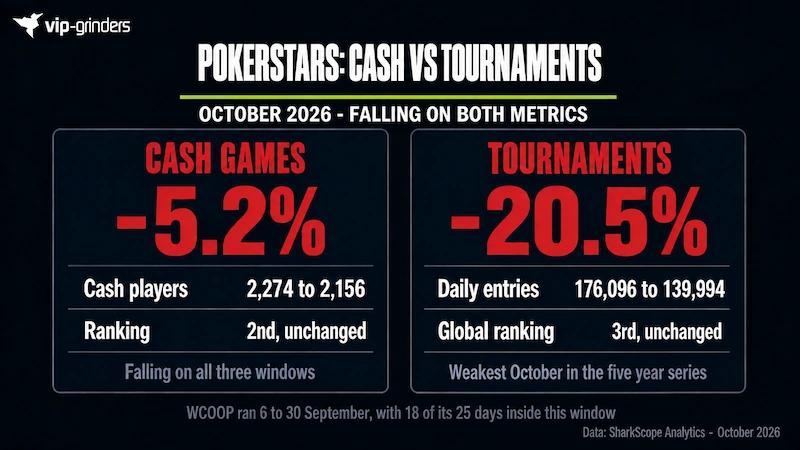
- WCOOP did not lift PokerStars: its tournament entries fell 20.5% to 139,994 with 18 of the series' 25 days inside this window, its weakest October in the five year series. Cash fell 5.2% to 2,156.
- CoinPoker's cash traffic recovered: it rose 6.3% to 2,057 across a window covering the end of GOPC and the two weeks after it, which fits players having moved into the series in September rather than leaving. It now sits 99 seats behind PokerStars, against 339 last month.
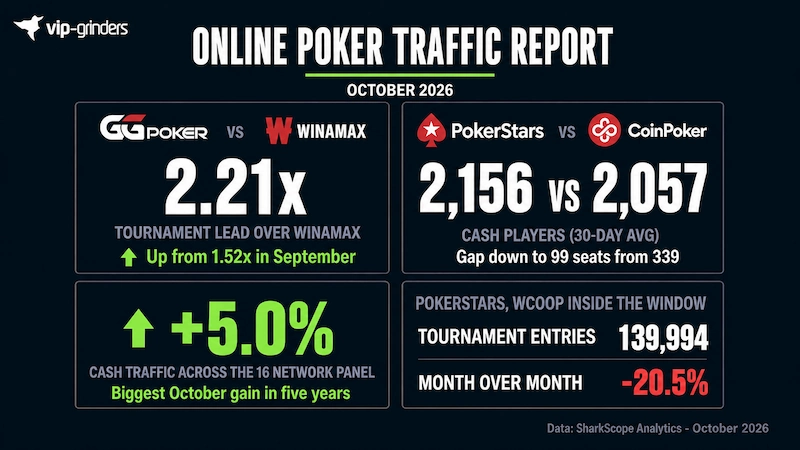
October is when tournament traffic normally drops back after the September series, and this year it did not. That is almost entirely GGPoker. The WSOP series ran to 29 September, Bounty Hunters started on 2 October and a $5 Ocean KO drew a record field, so GGPoker added 130,000 daily entries while Winamax and PokerStars lost more than 110,000 between them.
The PokerStars figure is the one I would watch. WCOOP paid out $49M and the network still lost a fifth of its daily entries across a month that held most of the series. A headline series does not hold up a network’s daily volume on its own.
What Changed in This Edition
Four changes affect how this edition reads against September, and none of them alters how any figure is calculated. They are set out here so anyone comparing the two editions can account for each one.
| Change | Detail | Where It Shows |
|---|---|---|
| WPN cash figures | PRO’s cash series for WPN starts on 10 October, covering the last three days of this window | Cash rankings, US Offshore pool, FAQ |
| Seasonal section renamed | Five Year September Comparison becomes Seasonal Comparison, now mid-September against mid-October | Seasonal Comparison |
| Wider PRO coverage | 86 networks across 20 player pools, adding an Albertan pool with no traffic data yet | Introduction, Smaller Pools |
| Pool totals now agree | PRO’s Player Pools tab and its ranked networks both give 24,747 cash seats | Global Market Overview, Methodology |
WPN enters the cash table at eleventh with 463 players, a figure drawn from three days rather than thirty. It is ranked because PRO’s own pool totals already include it, and its cash figure is kept out of every like for like total, month over month comparison and seasonal panel until it has a full window.
The seasonal heading was the only one on this page that named a month, and it will not change again. Pool level figures remain cash players from PRO’s Player Pools tab, the basis the September edition introduced when it corrected earlier editions that had printed PRO Score under that label.
Global Market Overview
The International pool holds 63.9% of all tracked cash game traffic and 58.5% of tournament entries, making it larger than every other pool combined on both metrics. Southern European ranks second on both, with 2,162 cash players and 466,914 daily tournament entries, which is 22.6% of the global total. Crypto stays third on cash at 2,057 players, ahead of the Italian market.
All figures in this section come from PRO’s Player Pools tab and are cash players and tournament entries. Shares use the 24,747 cash total and the 2,065,724 tournament total across the 13 reporting pools. Month over month changes are calculated by VIP-Grinders by summing PRO’s published figures for the networks ranked in each pool, in this edition and the last, so every one can be reproduced from the two ranking tables.
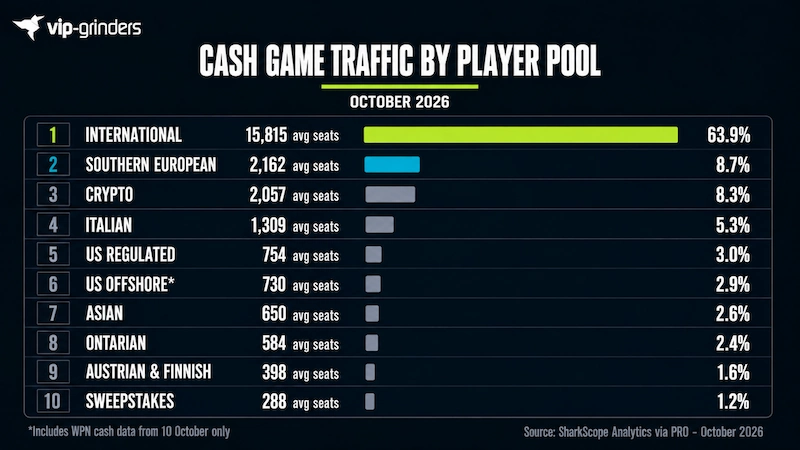
The chart above ranks pools by cash players only. The table below adds tournament entries, month over month movement on both metrics, and how many networks PRO tracks in each pool.
Three pools appear in the table but not the chart, because they report tournament entries and no cash figures at all: Canadian, Ukrainian and South African.
| Player Pool | Cash Players | Share | Cash MoM | MTT Entries | MTT MoM | Networks |
|---|---|---|---|---|---|---|
| International | 15,815 | 63.9% | +4.0% | 1,209,464 | +8.9% | 19 |
| Southern European | 2,162 | 8.7% | +5.5% | 466,914 | -13.5% | 7 |
| Crypto | 2,057 | 8.3% | +6.3% | 73,911 | +23.4% | 6 |
| Italian | 1,309 | 5.3% | +8.6% | 102,227 | -1.1% | 5 |
| US Regulated | 754 | 3.0% | +0.5% | 31,363 | +8.2% | 5 |
| US Offshore | 730 | 2.9% | -12.8% | 72,665 | -8.1% | 3 |
| Asian | 650 | 2.6% | -4.3% | 39,352 | +16.1% | 3 |
| Ontarian | 584 | 2.4% | +8.1% | 26,578 | -1.7% | 4 |
| Austrian & Finnish | 398 | 1.6% | +15.4% | 6,950 | +16.6% | 1 |
| Sweepstakes | 288 | 1.2% | -4.0% | 25,355 | +5.2% | 7 |
| Canadian | No cash data | n/a | n/a | 5,489 | -15.2% | 1 |
| Ukrainian | No cash data | n/a | n/a | 4,234 | +6.6% | 1 |
| South African | No cash data | n/a | n/a | 1,222 | -8.1% | 2 |
International’s 4.0% cash gain is almost entirely GGPoker, which added 798 seats while the pool’s other ranked networks lost 188 between them. Its 8.9% tournament gain comes from the same place.
Southern European added 5.5% in cash while losing 13.5% of its tournament entries. Winamax accounts for most of the cash gain and all of the tournament fall, with its September series closing on 17 September, four days into this window.
US Offshore reads 730 cash players against 298 in September, but 463 of those are WPN’s first three days of reporting. Without WPN the pool fell 12.8%, with Chico Poker Network down 11.7% and PaiWangLuo down to 18 players.
A further seven pools in PRO’s database report nothing on either metric and are excluded throughout.
Cash Game Traffic Rankings
The table below ranks every network that reported cash game data to SharkScope in October 2026, sorted by the 30-day average of concurrent players. This is the most direct measure of which poker rooms are busiest for real-money cash games right now.
Thirty networks now report cash figures, one more than last month, after WPN’s cash series began on 10 October. The six networks that report no cash data appear only in the tournament rankings.
All three columns are PRO’s own cash game figures at each window, so a network whose 7-day average sits below its 30-day has softened in the past week regardless of where the longer trend points. The month over month column compares this edition’s 30-day average against last edition’s.
| # | Network | Player Pool | Cash (30-Day Avg) | 7-Day Avg | 90-Day Avg | Month over Month |
|---|---|---|---|---|---|---|
| 1 | GGPoker | International | 10,143 | 10,164 | 9,709 | +8.5% |
| 2 | PokerStars | International | 2,156 | 2,035 | 2,197 | -5.2% |
| 3 | CoinPoker | Crypto | 2,057 | 1,887 | 2,025 | +6.3% |
| 4 | WPT Global | International | 1,793 | 1,787 | 1,742 | -3.0% |
| 5 | Winamax | Southern European | 1,194 | 1,059 | 1,071 | +8.3% |
| 6 | iPoker | International | 1,179 | 1,080 | 1,163 | -4.7% |
| 7 | PokerStars Italy | Italian | 701 | 681 | 688 | +5.9% |
| 8 | QQPK | Asian | 650 | 600 | 663 | -4.3% |
| 9 | PokerStars Europe | Southern European | 601 | 540 | 581 | +2.4% |
| 10 | iPoker Italy | Italian | 541 | 509 | 531 | +11.3% |
| 11 | WPN | US Offshore | 463 | 463 | 463 | New, 3 days of data |
| 12 | GGPoker Ontario | Ontarian | 444 | 440 | 436 | +10.4% |
| 13 | iPoker Austria & Finland | Austrian & Finnish | 398 | 347 | 358 | +15.4% |
| 14 | iPoker Europe | Southern European | 312 | 271 | 301 | -1.6% |
| 15 | Stake Poker | International | 280 | 265 | 276 | +8.9% |
| 16 | Chico Poker Network | US Offshore | 248 | 249 | 248 | -11.7% |
| 17 | FanDuel Poker | US Regulated | 231 | 230 | 223 | +3.1% |
| 18 | Stake.us Poker | Sweepstakes | 209 | 204 | 232 | -6.3% |
| 19 | WSOP Online | US Regulated | 203 | 210 | 201 | +4.6% |
| 20 | 888poker | International | 194 | 187 | 183 | +6.6% |
| 21 | BetMGM Poker | US Regulated | 191 | 211 | 189 | -5.4% |
| 22 | BetRivers Poker | US Regulated | 129 | 126 | 129 | -0.8% |
| 23 | Clubs Poker | Sweepstakes | 79 | 81 | 73 | +2.6% |
| 24 | PartyPoker | International | 70 | 66 | 66 | +14.8% |
| 25 | 888poker Italy | Italian | 68 | 62 | 64 | +17.2% |
| 26 | PokerStars on FanDuel Ontario | Ontarian | 64 | 72 | 60 | +1.6% |
| 27 | 888poker Europe | Southern European | 55 | 50 | 49 | +27.9% |
| 28 | BetMGM Ontario Network | Ontarian | 52 | 49 | 54 | 0.0% |
| 29 | 888poker Ontario | Ontarian | 24 | 26 | 24 | +4.3% |
| 30 | PaiWangLuo | US Offshore | 18 | 19 | 21 | -25.0% |
Eighteen of the 29 networks with a comparable figure gained cash traffic this month, ten lost and one was unchanged. GGPoker alone added 798 players, more than four times the net gain of the other 28 networks combined.
The top five networks hold 70.1% of all tracked cash players, and GGPoker’s 10,143 exceeds the next four combined at 7,200. Winamax moves up to fifth, passing iPoker by 15 players, 1,194 against 1,179.
Twenty-one of the 29 networks with a full window show a 7-day average below their 30-day, so most of the market ran softer in the final week. GGPoker is the clearest exception, at 10,164 on the 7-day against 10,143 on the month.
Tournament Traffic Rankings
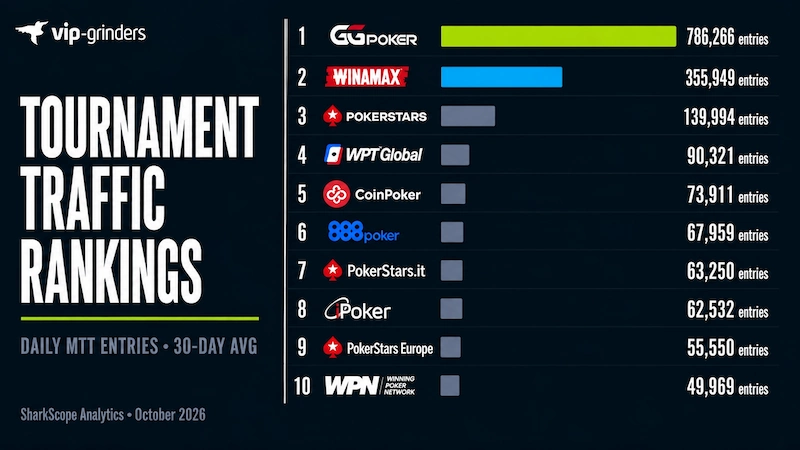
The table below covers all 36 tracked networks sorted by daily MTT entries on the 30-day average. Six networks that report no cash game data appear here only: Global Poker, Peoples Network, Canadian Poker Network, Stretch Network, Pokerbet UA and Pokerbet ZA.
All three columns are PRO’s own tournament entry figures at each window. Thirty-one of the 36 networks show a 7-day average above their 30-day, so the latest week ran ahead of the month across most of the market, with GGPoker’s Bounty Hunters, CoinPoker’s The One and ACR’s Venom Day 1s all running in it.
| # | Network | Player Pool | MTT Entries (30-Day Avg) | 7-Day Avg | 90-Day Avg | Month over Month |
|---|---|---|---|---|---|---|
| 1 | GGPoker | International | 786,266 | 886,850 | 700,819 | +19.9% |
| 2 | Winamax | Southern European | 355,949 | 377,048 | 378,793 | -17.5% |
| 3 | PokerStars | International | 139,994 | 176,455 | 158,017 | -20.5% |
| 4 | WPT Global | International | 90,321 | 85,723 | 79,835 | +24.2% |
| 5 | CoinPoker | Crypto | 73,911 | 95,783 | 72,702 | +23.4% |
| 6 | 888poker | International | 67,959 | 77,713 | 72,336 | +0.1% |
| 7 | PokerStars Italy | Italian | 63,250 | 75,727 | 68,360 | -8.1% |
| 8 | iPoker | International | 62,532 | 68,398 | 67,297 | -10.1% |
| 9 | PokerStars Europe | Southern European | 55,550 | 62,005 | 54,199 | +4.1% |
| 10 | WPN | US Offshore | 49,969 | 64,713 | 57,764 | -8.6% |
| 11 | PartyPoker | International | 49,467 | 54,333 | 51,388 | -9.7% |
| 12 | 888poker Europe | Southern European | 44,179 | 47,891 | 45,238 | +2.8% |
| 13 | QQPK | Asian | 39,352 | 37,844 | 37,411 | +16.1% |
| 14 | 888poker Italy | Italian | 16,268 | 16,288 | 16,692 | +13.5% |
| 15 | GGPoker Ontario | Ontarian | 15,760 | 16,579 | 15,969 | +5.7% |
| 16 | iPoker Italy | Italian | 13,870 | 15,223 | 13,593 | +13.9% |
| 17 | Global Poker | Sweepstakes | 12,414 | 14,123 | 11,557 | +5.5% |
| 18 | PaiWangLuo | US Offshore | 11,770 | 11,958 | 11,132 | -12.8% |
| 19 | WSOP Online | US Regulated | 11,534 | 13,670 | 10,287 | +21.0% |
| 20 | iPoker Europe | Southern European | 11,235 | 11,450 | 11,066 | -6.0% |
| 21 | Chico Poker Network | US Offshore | 10,926 | 11,723 | 10,586 | -0.1% |
| 22 | Peoples Network | Italian | 8,838 | 8,455 | 9,182 | +10.0% |
| 23 | BetRivers Poker | US Regulated | 8,565 | 8,945 | 7,952 | +15.5% |
| 24 | Stake Poker | International | 8,156 | 8,679 | 8,919 | -17.8% |
| 25 | 888poker Ontario | Ontarian | 7,647 | 9,330 | 8,122 | +0.3% |
| 26 | Clubs Poker | Sweepstakes | 7,572 | 7,660 | 6,869 | +1.2% |
| 27 | iPoker Austria & Finland | Austrian & Finnish | 6,950 | 6,902 | 5,988 | +16.6% |
| 28 | BetMGM Poker | US Regulated | 6,273 | 7,114 | 6,018 | -2.4% |
| 29 | Canadian Poker Network | Canadian | 5,488 | 6,012 | 6,063 | -15.2% |
| 30 | Stake.us Poker | Sweepstakes | 5,369 | 5,871 | 4,913 | +10.5% |
| 31 | FanDuel Poker | US Regulated | 4,990 | 5,944 | 5,886 | -11.1% |
| 32 | Stretch Network | International | 4,769 | 5,038 | 4,532 | +25.6% |
| 33 | Pokerbet UA | Ukrainian | 4,234 | 4,636 | 4,085 | +6.6% |
| 34 | BetMGM Ontario Network | Ontarian | 2,140 | 2,391 | 2,502 | -16.3% |
| 35 | Pokerbet ZA | South African | 1,222 | 1,016 | 1,442 | -8.1% |
| 36 | PokerStars on FanDuel Ontario | Ontarian | 1,032 | 1,253 | 1,223 | -46.7% |
GGPoker’s 786,266 daily entries exceed the next two networks combined at 495,943, and its lead over Winamax has widened to 2.21x from 1.52x last month. Winamax’s September series closed on 17 September, while GGPoker’s WSOP series ran to 29 September and Bounty Hunters followed on 2 October.
Poker Industry PRO reported on 9 October that the 2026 autumn tournament season had generated a record $600M+ in prize money. Entries are a different measure: across the 36 ranked networks they rose 2.0% this month, to 2,065,721.
Below the top four, the sharpest fall is between #13 QQPK at 39,352 and #14 888poker Italy at 16,268, where daily entries more than halve. Everything above that line is a top tier tournament product.
Several networks invert their cash standing. 888poker ranks #20 on cash with 194 players but #6 on tournaments with 67,959 daily entries, 888poker Europe #27 on cash against #12 on tournaments, and PartyPoker #24 against #11. All three are tournament products with a residual cash presence.
CoinPoker climbs from eighth to fifth on tournaments, at 73,911 daily entries, on the last 16 days of GOPC and the first nine of The One. PokerStars posts the largest fall in the top ten, down 20.5% to 139,994.
Seasonal Comparison
Monthly reports usually compare this month against last month, which cannot tell you whether a move is normal for the time of year. This section compares the move from mid-September to mid-October with the same move in each of the four previous years, using PRO’s daily series back to January 2022.
October is normally flat for cash games and a falling month for tournaments, as the September series end. In each of the four prior years cash moved by less than 1% and tournament entries fell by between 5.1% and 9.9%. This year broke both patterns.
Two constant panels are used so the comparison is like for like: 16 networks that reported cash figures on every one of these dates since 2022, and 24 networks that reported tournament entries. Networks that entered tracking later are excluded from the panels entirely rather than distorting them. The 2026 figures use PRO’s published 30-day averages, with the mid-September cash total as published in the September edition, and earlier years come from its daily series on 13 September and 12 October.
| Year | Cash, mid-September | Cash, mid-October | Change | MTT Change |
|---|---|---|---|---|
| 2022 | 13,018 | 13,108 | +0.7% | -6.1% |
| 2023 | 14,617 | 14,671 | +0.4% | -9.7% |
| 2024 | 14,118 | 14,236 | +0.8% | -9.9% |
| 2025 | 13,801 | 13,821 | +0.1% | -5.1% |
| 2026 | 16,033 | 16,838 | +5.0% | +0.1% |
Cash game traffic across the 16 network panel rose 5.0%, against moves of +0.7%, +0.4%, +0.8% and +0.1% in the four prior years. GGPoker supplied 798 of the panel’s 805 extra seats, so the other established networks held level.
Tournament entries across the 24 network panel held level, where every prior year fell by at least 5.1%. That reading needs one caveat, covered below.
Seasonal Baselines by Network
The same comparison at network level shows which rooms are running at their usual October pace and which are not. All five networks below have reported tournament entries continuously since 2022.
| Network, MTT entries | 2022 | 2023 | 2024 | 2025 | 2026 |
|---|---|---|---|---|---|
| GGPoker | +1.9% | -7.9% | -5.2% | +4.4% | +19.9% |
| Winamax | -15.8% | -24.4% | -29.8% | -20.8% | -17.5% |
| PokerStars | -9.0% | -6.5% | -14.1% | -6.2% | -20.5% |
| PokerStars Italy | -16.6% | -8.1% | -6.5% | -12.9% | -8.1% |
| PokerStars Europe | -30.9% | -23.8% | -11.1% | -17.4% | +4.1% |
GGPoker’s +19.9% is the strongest October it has posted in five years, against a previous best of +4.4% in 2025. Its WSOP series ran to 29 September, Bounty Hunters opened on 2 October and APT Online on 11 October, so its biggest series covered almost the whole window.
PokerStars sits at the other end. Its 20.5% fall is its weakest October in five years, against falls of 6.2% to 14.1% in prior years, even with 18 days of WCOOP inside this window.
Winamax’s 17.5% fall sits inside its usual October range of 15.8% to 29.8%. PokerStars Europe is the only other network here to gain, at +4.1% against falls in all four prior Octobers.
On cash, the same comparison shows how unusual GGPoker’s month was.
| Network, cash players | 2022 | 2023 | 2024 | 2025 | 2026 |
|---|---|---|---|---|---|
| GGPoker | -1.3% | +2.8% | +3.5% | -2.5% | +8.5% |
| PokerStars | +0.6% | -4.4% | +2.2% | +5.3% | -5.2% |
| iPoker | -4.0% | +7.2% | +2.1% | +1.0% | -4.7% |
| PokerStars Italy | +11.8% | -4.9% | +7.6% | -9.3% | +5.9% |
| PokerStars Europe | -3.7% | -6.7% | -1.7% | +0.6% | +2.4% |
GGPoker’s +8.5% is more than double its previous best October, +3.5% in 2024. PokerStars and iPoker both posted their weakest October on cash in five years.
Online Poker Traffic Trends
This section reads the same networks across three timeframes. A 7-day average below the 30-day means the past week ran slower than the month; a 30-day above the 90-day means the month ran ahead of the quarter. Stacking the three separates a short dip from a longer decline.
Overall Market Direction
Is online poker growing or declining? This month both metrics grew against the quarter, and both behaved differently in the final week.
Cash game traffic across the 36 ranked networks totals 24,747 on the 30-day average, 23,970 on the 7-day and 24,020 on the 90-day. The month ran 3.0% ahead of the quarter and the past week ran 3.1% below the month, so the month was strong but its final week was softer than the month as a whole.
That softening is broad. Twenty-one of the 29 networks with a full cash window sit below their own 30-day average on the past week, while only five of them sit below their 90-day average on the month.
Tournament entries total 2,065,721 on the 30-day average against 2,028,737 on the 90-day and 2,310,743 on the 7-day, which is 11.9% above the monthly pace. GGPoker alone accounts for 100,584 of the 245,022 extra daily entries, with Bounty Hunters, APT Online and a record Ocean KO field all inside the past week. CoinPoker’s The One and ACR’s Venom Day 1s ran in the same seven days.
Momentum Shifts
The table below shows seven networks where the three cash windows tell a divergent story. The signal column gives a one phrase reading.
| Network | 90-Day | 30-Day | 7-Day | Signal |
|---|---|---|---|---|
| GGPoker | 9,709 | 10,143 | 10,164 | Rising on every window |
| PokerStars | 2,197 | 2,156 | 2,035 | Falling on every window |
| CoinPoker | 2,025 | 2,057 | 1,887 | Month up, week down during The One |
| WPT Global | 1,742 | 1,793 | 1,787 | Steady, 90-day still partial |
| Winamax | 1,071 | 1,194 | 1,059 | Strong month, week back to its quarter |
| iPoker | 1,163 | 1,179 | 1,080 | Lost fifth place, softer week |
| WPN | 463 | 463 | 463 | Three days of data on every window |
Four of the 29 cash networks with a full window fall across all three windows: PokerStars, QQPK, Stake.us Poker and BetMGM Ontario Network. Last month eleven did, so the sustained decline September showed has narrowed to a handful of networks.
Five rise across all three: GGPoker, WSOP Online, BetMGM Poker, Clubs Poker and PokerStars on FanDuel Ontario. Only GGPoker among those five holds more than 250 players.
Key Movers This Month
- GGPoker: cash up 8.5% to 10,143, its highest level since March, and tournament entries up 19.9%, its strongest October in five years.
- PokerStars: tournament entries down 20.5% with WCOOP inside the window, and cash falling on all three windows.
- CoinPoker: cash up 6.3% to 2,057 after GOPC, now 99 seats behind PokerStars.
- Winamax: cash up 8.3% and up to fifth, while tournament entries fell 17.5% once its series closed.
GGPoker is the largest change in the dataset on both metrics. Cash players rose from 9,345 to 10,143, a gain of 8.5% and its highest 30-day level since March, and the network is rising on all three windows at 9,709, 10,143 and 10,164.
Most of that gain arrived late. Its 30-day average rose slowly from 9,345 on 13 September to 9,709 on 8 October, then climbed to 10,143 in the last four days of the window, alongside the Bounty Hunters series and an $18M October promotions package.
Tournament entries rose 19.9% to 786,266, its strongest October in five years. The WSOP branded online series ran on GGPoker to 29 September with 3.04M entries, and is separate from WSOP Online, the US regulated network ranked elsewhere in this report, which runs its own schedule. PokerNews reported on 12 October that a $5 Ocean KO on GGPoker had set an all-time record for a tournament field.
Its cash lead widened too. Its 10,143 players exceed the next four networks combined by 2,943, against a margin of 2,050 last month.
PokerStars is the result the September edition said to wait for, and it went the wrong way. Tournament entries fell from 176,096 to 139,994, a fall of 20.5%, across a window that held 18 of WCOOP’s 25 days, and PRO’s daily series has no gaps, with its 30-day average peaking at 179,978 on 15 September and falling through most of the window after that.
WCOOP itself was not small. It ran 121 events from 6 to 30 September, was reported at its close as paying out just over $49M, and its $109 Main Event drew 14,533 entries.
Cash fell 5.2% to 2,156 and is falling on all three windows, at 2,197, 2,156 and 2,035. PokerStars UK moved its players onto the Betfair platform during the window, but PRO lists Betfair Poker UK under the PokerStars network, so that move does not take traffic out of these figures. No cause for the tournament fall has been identified.
CoinPoker answers the question the September edition left open. Cash players rose 6.3% to 2,057 across a window that covers the last 16 days of its $50M GOPC series and the two weeks after it, and its 30-day average climbed from 1,935 through most of the window.
GOPC paid out $88.44M across 6,321 tournaments, and CoinPoker’s tournament entries rose 23.4% to 73,911, taking it from eighth to fifth on tournaments. The One followed from 4 to 12 October, and the 7-day figures show the same pull as September: cash at 1,887 sits below the month while entries reach 95,783.
The gap behind PokerStars on cash has narrowed from 339 seats to 99 on the 30-day average.
Winamax recovered part of September’s fall. Cash players rose 8.3% to 1,194, taking it up to fifth, above iPoker, after the 18.5% drop to 1,103 reported last month. Its 7-day figure of 1,059 sits back near its 90-day level of 1,071, so the recovery is not yet holding into the latest week.
Tournament entries fell 17.5% to 355,949 once the Winamax Series closed on 17 September. The series ran 352 events with €30M guaranteed, and its 3 Million Event drew 34,259 entries.
WPN enters the cash rankings at eleventh with 463 players on three days of data, the second new cash reporter in two months after WPT Global. Its tournament entries fell 8.6% to 49,969, with ACR’s Dual Venom PKOs running Day 1s from 4 October on $6.5M guaranteed across the two events.
Traffic by Market
The sections above rank networks individually. This section groups them by player pool, where regulation, liquidity rules and seasonality differ enough to move the numbers independently of each other.
Pool totals come from PRO’s Player Pools tab. This month they match the sum of the networks ranked in each pool to within one player on cash, and exactly in total.
International
The International pool is the largest by a wide margin: 15,815 cash players and 1,209,464 daily tournament entries across 19 networks and 171 poker sites. That is 63.9% of global cash traffic and 58.5% of tournament entries.
Eight of those 19 networks are ranked individually and account for the whole pool on both metrics. GGPoker alone holds 64.1% of the pool’s cash traffic and 65.0% of its entries.
The pool’s 4.0% cash gain is GGPoker’s: it added 798 seats while the other ranked networks lost 188 between them. PokerStars is the weakest large constituent at 2,156 cash players, down 5.2% and falling on all three windows.
Southern European
The Southern European pool holds 2,162 cash players and 466,914 daily tournament entries across seven networks and 21 poker sites. It is second globally on both metrics, at 8.7% of world cash traffic and 22.6% of tournament entries.
Winamax dominates it, with 1,194 of the pool’s cash players and 355,949 of its entries. Its 8.3% cash recovery drove most of the pool’s 5.5% gain, and the close of its September series drove all of the 13.5% tournament fall.
The other three ranked networks moved by 14 seats or fewer on cash, at 601 for PokerStars Europe, 312 for iPoker Europe and 55 for 888poker Europe. On tournaments PokerStars Europe rose 4.1%, against falls in each of its four previous Octobers, 888poker Europe rose 2.8% and iPoker Europe fell 6.0%. France, Spain and Portugal share liquidity in this pool; Italy does not.
Italian
Italy is ring fenced, with 1,309 cash players and 102,227 daily tournament entries across five networks and 35 poker sites, more branded sites than any pool except International. Cash rose 8.6% and entries fell 1.1%.
Four networks are ranked: PokerStars Italy at 701 cash players and 63,250 entries, iPoker Italy at 541 and 13,870, 888poker Italy at 68 and 16,268, and Peoples Network with no cash data and 8,838 entries. PokerStars Italy’s ICOOP series finished at the end of September, and its entries still fell 8.1%.
The market is working through a concession reform. Licences now carry a €7M fee for a nine year term, poker gross gaming revenue is taxed at 25.5%, and the multi skin model that let one operator run dozens of branded rooms has been abolished.
Crypto
PRO tracks six networks in the Crypto pool, holding 2,057 cash players and 73,911 daily tournament entries. Only CoinPoker is ranked individually, and this month its figures equal the pool’s exactly on both metrics.
Crypto is the third largest cash pool in the world, at 8.3% of global traffic, ahead of Italy. That places crypto poker above several regulated national markets on liquidity alone.
CoinPoker’s cash rose 6.3% across a window that covered the end of its $50M GOPC series and the start of The One. BCPoker, the poker vertical of BC.GAME Group, still does not report to SharkScope and is therefore absent from these figures.
US Regulated
The regulated US market holds 754 cash players and 31,363 daily tournament entries across five networks and 23 poker sites, four of which are ranked individually, and is 3.0% of global cash traffic. Cash rose 0.5% and entries 8.2%, so after a month negative on both metrics the pool is positive on both.
| Network | Cash Players | MTT Entries | Cash MoM |
|---|---|---|---|
| FanDuel Poker | 231 | 4,990 | +3.1% |
| WSOP Online | 203 | 11,534 | +4.6% |
| BetMGM Poker | 191 | 6,273 | -5.4% |
| BetRivers Poker | 129 | 8,565 | -0.8% |
WSOP Online led the tournament gain, up 21.0% to 11,534, with its fall bracelet series running from 27 September across Nevada, New Jersey, Michigan and Pennsylvania. FanDuel Poker’s entries fell 11.1% even with its Dynasty Series running from 12 to 28 September.
The pool has been absorbing structural change since PokerStars moved its US business onto FanDuel on 1 April 2026, merging Michigan, New Jersey and Pennsylvania into the single pool now ranked as FanDuel Poker. No state entered or left MSIGA during this window.
US Offshore
The Offshore pool covers US facing networks operating without local US licences: 730 cash players and 72,665 daily tournament entries across three networks. WPN accounts for 463 of those cash players on its first three days of reporting.
WPN is also the largest on tournaments at 49,969 entries, down 8.6%. Chico Poker Network holds 248 cash players and 10,926 entries, PaiWangLuo 18 and 11,770, and without WPN the pool’s cash fell 12.8%.
ACR, the flagship room on WPN, opened Day 1s of its Dual Venom PKOs on 4 October with $6.5M guaranteed across the two events, so the series runs across this window and the next. Michigan’s regulator sent cease and desist letters to 33 offshore gambling sites on 8 October, and none of the 21 it named was a poker site.
Asian
The Asian pool holds 650 cash players and 39,352 daily tournament entries across three networks, of which only QQPK is ranked, and its figures equal the pool’s on both metrics. Cash fell 4.3% and entries rose 16.1%.
The pool is small for structural reasons rather than commercial ones. India’s Promotion and Regulation of Online Gaming Act took effect on 1 May 2026, banning real money online gaming nationwide, and PokerBaazi, previously the country’s leading operator, moved to a free to play subscription model.
That removed one of the largest ring fenced poker markets in the world from tracking entirely. Asian poker traffic as measured here is effectively one network serving one region.
Ontarian and Canadian
Ontario is regulated separately from the rest of Canada and holds 584 cash players and 26,578 daily tournament entries across four networks. GGPoker Ontario dominates with 444 cash players, 76% of the pool, and 15,760 entries.
The other three are small: PokerStars on FanDuel Ontario at 64 cash players and 1,032 entries, BetMGM Ontario Network at 52 and 2,140, and 888poker Ontario at 24 and 7,647. The Supreme Court of Canada heard the case on international shared liquidity for Ontario on 7 October and reserved judgment, with no timeline announced.
Outside Ontario, PRO’s Canadian pool holds one network, Canadian Poker Network, which reports 5,488 daily entries, down 15.2%, and no cash data. Alberta is moving to its own regulated market: PRO now lists a separate Albertan pool, 888 launched a ring fenced Alberta site on 13 October, the day after this window closed, and PokerStars had told players on 9 October it would stop offering poker there from that date.
Sweepstakes
The sweepstakes pool holds 288 cash players and 25,355 daily tournament entries across seven networks. Cash fell 4.0% and entries rose 5.2%, and the cash change is 12 seats on a pool of under 300.
Three networks are ranked: Global Poker at 12,414 entries and no cash data, Clubs Poker at 79 cash players and 7,572 entries, and Stake.us Poker at 209 and 5,369.
The pool remains under regulatory pressure. VGW, which operates Global Poker, settled with the New York Attorney General for $8M in September, ClubWPT Gold stopped sweepstakes play in Nevada on 28 September, and Oklahoma’s sweepstakes ban takes effect on 1 November.
Smaller Pools
Three pools sit below the thresholds above. Austrian and Finnish holds 398 cash players and 6,950 entries on a single network, iPoker Austria & Finland, which grew 15.4% and 16.6%.
Ukrainian and South African report tournament entries only, at 4,234 and 1,222 respectively, up 6.6% and down 8.1%.
PRO tracks seven further pools that report no traffic data at all: Albertan, Club apps, Czech, Georgian, Russian, Slovakian and South American. These are excluded from every figure in this report.
Traffic by Operator
Individual networks understate how concentrated this market is, because the largest companies run several pools each. Flutter operates six networks across 28 poker sites, Evoke five across 17, and Entain two across 31. The table below aggregates the ranked networks by parent company.
Network and poker site counts are PRO’s own, taken from its Companies tab, which lists 19 tracked network operators. Cash and tournament totals are summed by VIP-Grinders from the ranking tables above, so they cover only the networks PRO ranks individually.
| Operator | Ranked Networks | Poker Sites | Cash Players | Daily MTT Entries |
|---|---|---|---|---|
| NSUS (GGPoker) | 2 of 2 | 15 | 10,587 | 802,026 |
| Flutter (PokerStars / FanDuel) | 5 of 6 | 28 | 3,753 | 264,816 |
| Playtech (iPoker) | 4 of 4 | 0 | 2,430 | 94,587 |
| Precise Interactive (CoinPoker) | 1 of 1 | 1 | 2,057 | 73,911 |
| Seventip NV (WPT Global) | 1 of 1 | 1 | 1,793 | 90,321 |
| Winamax SA | 1 of 1 | 2 | 1,194 | 355,949 |
| QQPoker (QQPK) | 1 of 1 | 1 | 650 | 39,352 |
| Easygo (Stake / Stake.us) | 2 of 2 | 1 | 489 | 13,525 |
| Evoke (888poker) | 4 of 5 | 17 | 341 | 136,053 |
| BetMGM | 2 of 2 | 4 | 243 | 8,413 |
| Caesars (WSOP Online) | 1 of 1 | 4 | 203 | 11,534 |
| Rush Street Interactive (BetRivers) | 1 of 1 | 7 | 129 | 8,565 |
| KHK Games (Clubs Poker) | 1 of 1 | 1 | 79 | 7,572 |
| Entain (PartyPoker) | 1 of 2 | 31 | 70 | 49,467 |
| VGW Group (Global Poker) | 1 of 1 | 1 | No cash data | 12,414 |
| Microgame (Peoples Network) | 1 of 1 | 1 | No cash data | 8,838 |
| IGT (Canadian Poker Network) | 1 of 1 | 0 | No cash data | 5,488 |
| BetConstruct (Stretch Network) | 1 of 1 | 0 | No cash data | 4,769 |
| Pokerbet | 1 of 1 | 3 | No cash data | 4,234 |
NSUS holds 2.82 times the cash game traffic of Flutter across all pools, up from 2.56 last month. GGPoker’s International network alone, at 10,143 players, carries more than two and a half times Flutter’s combined 3,753 across five ranked networks.
Seventip NV, with one network and one poker site, carries more cash traffic than Evoke does across four ranked networks and 17 sites. Precise Interactive runs one network with 2,057 cash players, 373 fewer than Playtech’s entire four network iPoker ecosystem at 2,430, a gap that narrowed from 450 last month.
Tournaments are distributed differently. Winamax generates 355,949 daily entries from a single pool, more than Evoke (136,053) and Playtech (94,587) combined. Entain runs roughly 707 daily entries for every concurrent cash seat and Evoke 399, the two most tournament dependent ratios of any operator with cash data.
Entain is the sharpest example of site count telling you nothing about liquidity. It operates 31 poker sites, more than any other tracked operator, and its single ranked network carries 70 cash players.
How Rakeback Relates to Traffic
Traffic volume directly affects game quality, table selection and rakeback value. Networks with more players run more tables across more stakes and formats, with shorter waits and softer pools.
For grinders earning rakeback as a percentage of the rake they generate, a higher traffic network usually means more hands per hour and more consistent earning. The three timeframes matter here too: a network whose 7-day average sits well below its 30-day is thinner right now than its headline figure suggests.
Two networks in this edition show why that distinction is worth checking before moving volume. Winamax reads 1,194 on the month and 1,059 on the past week, and CoinPoker 2,057 against 1,887 while The One was running.
Frequently Asked Questions
Which online poker site has the most traffic?
GGPoker has the most traffic of any online poker site. As of October 2026, GGPoker averages 10,143 concurrent cash game players and 786,266 daily tournament entries on the 30-day average. That is more cash game players than the next four networks combined (PokerStars, CoinPoker, WPT Global and Winamax), which total 7,200, and GGPoker is operated by NSUS Group and serves the international player pool.
How is online poker traffic measured?
Online poker traffic is measured using two metrics. Cash game players count the average number of concurrent real-money seats filled over a 24-hour period (PST), and tournament entries count the total daily entries into real-money scheduled multi-table tournaments, excluding sit-and-gos and lottery formats. This report uses data from SharkScope Analytics, accessed via Poker Industry PRO, covering 36 poker networks across 13 reporting player pools, with each metric published at 7-day, 30-day and 90-day trailing averages.
Is online poker growing or declining in 2026?
Online poker grew in October 2026 on both metrics. Across the 16 networks with cash data on every comparison date since 2022, cash players rose 5.0%, from 16,033 to 16,838, the largest October gain in five years against gains of 0.1% to 0.8% in 2022 through 2025. Tournament entries rose 2.0% across the 36 ranked networks to 2,065,721 daily entries, and the constant 24 network panel held level in a month when it fell by 5.1% to 9.9% in each of the four prior years, with GGPoker accounting for most of both gains.
What is the busiest poker network in the world?
GGPoker is the busiest poker network in the world by both cash game players and tournament entries, with 10,143 concurrent cash players and 786,266 daily tournament entries on the 30-day average. Its parent company NSUS controls 2.82 times the cash game traffic of Flutter, which operates the PokerStars and FanDuel networks, up from 2.56 times in September.
Which crypto poker room has the most players?
CoinPoker is the largest crypto poker room tracked by SharkScope, with 2,057 concurrent cash game players and 73,911 daily tournament entries on the 30-day average. It ranks third globally by cash game players, behind GGPoker and PokerStars, and the crypto pool it makes up is the third largest player pool in the world by cash traffic, ahead of Italy. BCPoker, the poker vertical of BC.GAME Group, does not report to SharkScope and is not included.
How does GGPoker compare to PokerStars in traffic?
GGPoker exceeds PokerStars on both metrics. GGPoker averages 10,143 cash game players against 2,156 for the PokerStars International network, and 786,266 daily tournament entries against 139,994. Combining all five networks that Flutter operates and this report ranks, including FanDuel Poker, the total of 3,753 cash players is still well under half of GGPoker alone.
Why did WPN appear in the cash game rankings this month?
WPN’s cash game figures appear in Poker Industry PRO’s data from 10 October 2026, so it enters the October rankings in eleventh place with 463 cash players on three days of data. Its 7-day, 30-day and 90-day cash averages all rest on those same three days, so they are not yet comparable with other networks. This edition ranks it because PRO’s pool totals include it, but keeps it out of every like for like total and month over month comparison until it has a full window.
Which poker market segment is growing fastest?
On tournament entries, the crypto pool grew fastest at 23.4%, followed by Austrian and Finnish at 16.6% and Asian at 16.1%. On cash game players, Austrian and Finnish posted the largest percentage gain at 15.4% on a single network, and Italy is the fastest growing sizeable pool at 8.6%. US Offshore reads higher only because WPN’s cash figures were added this month; without them it fell 12.8%.
Methodology & Data Sources
This report is published by VIP-Grinders, an independent poker and iGaming affiliate established in 2013. Every ranking figure comes from a single primary source, and every figure we calculate ourselves is identified below.
Primary Data: SharkScope via Poker Industry PRO
All traffic data comes from SharkScope Analytics, accessed through Poker Industry PRO. PRO tracks 86 networks across 20 player pools; this report covers the 36 it ranks individually, spanning the 13 pools that report traffic.
- What it measures: cash game players, meaning the average number of concurrent real-money seats filled over a 24-hour period (PST), and tournament entries, meaning total daily entries into real-money scheduled multi-table tournaments. Both are published at 7-day, 30-day and 90-day trailing averages.
- What it does not measure: unique players, registered accounts, rake generated, revenue, deposits, sit-and-gos or lottery formats such as Spin & Go. Re-entries and late registrations count as separate entries.
- Window dates for this edition: data was exported on 14 October 2026 and covers figures through 12 October. PRO's displayed averages lag the export date, by two days this month as in September, so the window is read from the data each month rather than assumed. The 7-day window covers 6 to 12 October, the 30-day window 13 September to 12 October, and the 90-day window 15 July to 12 October.
- Daily series: PRO also holds a daily traffic series running back to January 2022, which is the source for every year before 2026 in the seasonal comparison. It is not published as a monthly archive, so those figures cannot be checked against PRO's public pages.
- PRO Score is not used: PRO publishes a composite blending cash and tournament traffic into one number, calculated on a 30-day Hull moving average while the figures beside it are simple trailing averages. PRO does not publish the weighting between the two metrics, so no ranking or share in this report uses it.
Derived Metrics
Several figures here are calculated by VIP-Grinders from PRO’s published data rather than reported by PRO.
- Month over month change: this edition's 30-day figure against the previous edition's, using PRO's published numbers in both cases. Every one can be reproduced from the two ranking tables in each edition. Networks new to cash tracking carry no month over month figure until they have a full window.
- Seasonal comparison: calculated using the same two anchor dates every year, 13 September and 12 October, from PRO's daily series for 2022 to 2025 and from PRO's published figures for 2026, with the mid-September cash total as published in the September edition. Two constant panels are used, 16 networks for cash and 24 for tournaments, each containing only networks reporting on all ten of those dates.
- Pool shares: each pool's figure divided by the 24,747 cash total or the 2,065,724 tournament total across the 13 reporting pools, both taken from PRO's Player Pools tab.
- Pool month over month: summed from the networks ranked in each pool, not from the pool totals, because PRO publishes no monthly pool archive. Networks new to cash tracking are left out of the cash comparison until they have a full window.
- Operator totals: cash and tournament figures summed from the ranked networks belonging to each parent company. Network and poker site counts in that table are PRO's own, taken from its Companies tab.
Editorial Independence
VIP-Grinders has no commercial relationship with SharkScope Analytics or Poker Industry PRO, and neither reviewed this report before publication. No poker network pays for inclusion in this dataset, for its position in any ranking, or for how it is described.
VIP-Grinders operates affiliate relationships with some of the networks listed here, disclosed on their individual review pages. Rankings are determined solely by the cash game and tournament figures PRO publishes.
Where our findings contradict something we previously published, we say so in the text rather than quietly restating it. This edition checks two calls from September: CoinPoker’s cash recovered after GOPC, as that edition suggested, while WCOOP did not lift PokerStars’ monthly volume, and both are recorded beside the Momentum Shifts table.
Secondary Sources
Context, dates and regulatory information come from the sources below. These are not traffic data. They are used to explain movements the traffic figures cannot explain by themselves, and any movement without an identified cause is described that way in the text.
| Source | What It Provides | Where It Is Used |
|---|---|---|
| Poker Industry PRO news and network pages | Autumn prize money total, PokerStars site list | Tournament rankings, Key Movers |
| Operator series schedules and results | Dates, guarantees, entries and payouts | WCOOP, Winamax Series, GOPC, The One, WSOP Online, Bounty Hunters, APT Online, ICOOP, Dynasty Series, WSOP.com fall series, ACR Venom |
| PokerNews, Pokerfuse and CardPlayer reporting | Series results and the Ocean KO field record | Key Movers, Traffic by Market |
| Italian ADM concession reform | Licence fees and skin rules | Italian pool background |
| New York Attorney General | VGW settlement, September 2026 | Sweepstakes pool |
| US state legislation and regulators | Sweepstakes bans, the ClubWPT Gold Nevada exit, Michigan cease and desist letters | Sweepstakes pool, US Offshore pool |
| India Online Gaming Act 2025 | Real money gaming ban | Asian pool |
| Supreme Court of Canada and operator notices | Shared liquidity hearing, Alberta launch and exit, platform migrations | Ontarian and Canadian pools, US Regulated pool |
Limitations
Known limitations readers should weigh when interpreting anything on this page.
- Coverage changes between editions: when SharkScope begins tracking a network, the tracked total rises without any player joining the market. WPN added 463 cash players this month for that reason alone, and every total affected by it is quoted both ways.
- Partial windows: a network new to tracking carries 7-day, 30-day and 90-day figures drawn from however many days exist. WPN's three cash windows all rest on the three days since 10 October, and WPT Global's 90-day figure still covers only the 52 days since 22 August, so neither is fully comparable with other networks.
- Averages are not point-in-time values: a 90-day figure is the mean across 90 days, not the level on one date 90 days ago. A network below its 90-day average has run below its quarterly pace, which is not the same claim.
- The 7-day window is short: a single series day or a quiet weekend moves it materially. It is published as a momentum indicator against the 30-day figure, not as a standalone ranking.
- Pool and network totals: PRO's Player Pools tab and the 36 ranked networks agree at 24,747 cash players this month, but differed by a few dozen in earlier editions and can differ by a player within a single pool because of rounding. Neither is adjusted here, and each table states which one it uses.
- Rounding on small networks: PRO publishes whole players, so PaiWangLuo's move from 24 to 18 reads as a 25.0% fall when the underlying change may be smaller. Percentages below roughly 100 players should be read as direction rather than magnitude.
- Weekday mix: a 30-day window contains two days of the week five times, and which two depends on the end date. This edition's window holds five Sundays and five Mondays, against five Saturdays and five Sundays in September, so tournament averages are compared across slightly different weeks.
- Not a player count: a network showing 1,000 cash players has roughly 1,000 seats occupied at any moment, not 1,000 individuals. Multi-tabling means one player can fill several seats at once.
- Networks outside the dataset: any network that does not report to SharkScope is absent, including BCPoker and the 12 operators PRO lists as untracked. Seven player pools report no traffic data at all.
Update Schedule
This report is part of the VIP-Grinders research programme and is updated in the middle of each month. Each edition refreshes every PRO export, recalculates the derived metrics and restates the export and window dates.
Section headings on this page are fixed and will not change between editions, so a link to a specific section will keep working. Figures, findings and commentary change every month.
It sits alongside our monthly Prediction Markets Report, which tracks event contract volume across 11 platforms, and our Crypto Casino Market Report, which tracks onchain deposit volume across 41 operators.
If you are a journalist, researcher or analyst using data from this report, contact Mark Patrickson at VIP-Grinders for verification, additional context or access to the underlying tables.